|
The release of the October employment data on Friday had a big downside surprise in the
headline with its meager increase of 12,000 in nonfarm payrolls. There are two special factors
that pulled down the headline number. First and foremost is that strike activity reduced payrolls
in manufacturing by 38,000 and by 3,400 in leisure and hospitality. These jobs will come back
just as soon as the strikes are settled. If these jobs are added back in, payroll growth would
have looked softer, but not worrisomely so. Second, while the BLS methodology does not
quantify major weather impacts such as those from Hurricanes Helene and Milton, it is probable
that there was some short-term loss of jobs in the Southeast where the devastation was
widespread.
Beyond the headline, the rest of the report showed that average hourly earnings are growing on
trend in recent months, and that the workweek is stable. The unemployment rate was
unchanged at 4.1 percent in October. The labor force declined 220,000 in October, with the
number of employed down 368,000 and the number of unemployed up 150,000. This could in
part be storm impacts as those surveyed by the Southeast reported separations from work. In
past episodes, survey respondents are sometimes unclear if they are unemployed from a job
loss or only temporarily laid off. This time around is probably no different.
In sum, the October employment report needs to be read carefully and treated as a one-off until
more data becomes available.
 Monthly CPI data show headline inflation in Australia fell from 2.7 percent in August to 2.1 percent in September, below the consensus forecast of 2.5 percent. This is the fourth consecutive decline in headline inflation and its lowest level since July 2021. Headline inflation has now been within the Reserve Bank of Australia's target range of two percent to three percent for two months after it had been above that range for nearly three years. This monthly indicator measures the year-over-year change in the CPI index compared with the same month twelve months earlier. Monthly CPI data show headline inflation in Australia fell from 2.7 percent in August to 2.1 percent in September, below the consensus forecast of 2.5 percent. This is the fourth consecutive decline in headline inflation and its lowest level since July 2021. Headline inflation has now been within the Reserve Bank of Australia's target range of two percent to three percent for two months after it had been above that range for nearly three years. This monthly indicator measures the year-over-year change in the CPI index compared with the same month twelve months earlier.
The fall in headline inflation in September was again largely driven by energy costs, with automotive fuel prices falling 14.0 percent on the year after a previous decline of 7.6 percent and electricity prices falling 24.1 percent on the year after a previous decline of 17.9 percent. This fall in electricity prices was mainly driven by government rebates. Other categories of spending also recorded smaller price increases, including food, housing, and communications.
Today's data also show a moderation in underlying price pressures in September. The measure of inflation that excludes volatile items – including fuel and holiday travel – fell from 3.0 percent in August to 2.7 percent in September while the monthly trimmed mean measure fell from 3.4 percent to 3.2 percent.
At the RBA's previous meeting, held last month, officials highlighted uncertainties impacting the inflation outlook and again reiterated that returning inflation to target remains their highest priority. Officials also noted that they see little prospect of reducing policy rates over the rest of the year. Though September's update showing a moderation in underlying prices pressures will be welcomed by the RBA, officials have previously advised that they will discount the impact of the government rebates on headline inflation.
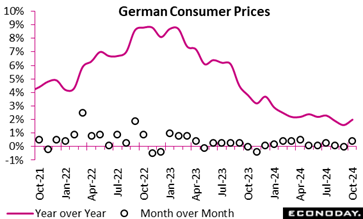 The flash October annual CPI inflation rate was 2.0 percent, slightly above forecasts and up from September's final 1.6 percent. Month-over-month, consumer prices rose 0.4 percent. The flash October annual CPI inflation rate was 2.0 percent, slightly above forecasts and up from September's final 1.6 percent. Month-over-month, consumer prices rose 0.4 percent.
The harmonised index of consumer prices, which aligns with European inflation metrics, registered a 2.4 percent yearly rise, up from 1.8 percent, and also posted a 0.4 percent monthly increase. Excluding volatile categories such as food and energy, core CPI inflation stands higher at 2.9 percent, up from 2.7 percent and showing that underlying price pressures are more pronounced outside these essential areas.
The increase in core inflation makes for a flat underlying trend since July and may help to temper market speculation about the pace of future ECB easing. It also boosted the likelihood of a pick-up in the Eurozone rate due for release tomorrow.
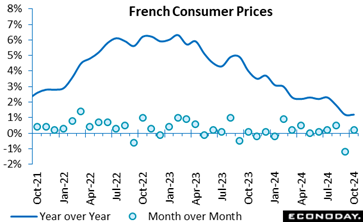 In October, the consumer price index provisionally rose 1.2 percent year-over-year, matching the consensus and up from September's 1.1 percent. Inflation is stable due to slower service cost increases and lower energy prices than last month. Manufacturing, food, and tobacco prices are likely to stay stable year-over-year, matching September's patterns. In October, the consumer price index provisionally rose 1.2 percent year-over-year, matching the consensus and up from September's 1.1 percent. Inflation is stable due to slower service cost increases and lower energy prices than last month. Manufacturing, food, and tobacco prices are likely to stay stable year-over-year, matching September's patterns.
Consumer prices rose 0.2 percent month-over-month in October after falling 1.2 percent in September. Higher energy costs, notably petroleum and gas, and seasonal increases in apparel, footwear, transport, and fresh food prices are drivers of the uptick, while tobacco costs remain stable.
Similarly, the harmonised index of consumer prices were up 1.5 percent year-over-year and 0.3 percent month-over-month. This slight uptick may balance year-end inflation forecasts as energy and critical goods prices rise.
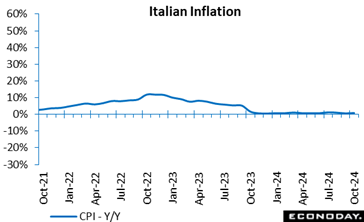 October consumer prices were provisionally unchanged on a monthly basis. Annual inflation was 0.9 percent, up from September's 0.7 percent. The increase here was primarily due to higher rates in processed food including alcohol (from 1.5 percent to 2.0 percent), unprocessed food (from 0.3 percent to 3.3 percent), non-regulated energy products (from minus 11.0 percent to minus 10.2 percent) and in transport services (from 2.4 percent to 2.8 percent). Inflation also eased in recreational and personal care services. October consumer prices were provisionally unchanged on a monthly basis. Annual inflation was 0.9 percent, up from September's 0.7 percent. The increase here was primarily due to higher rates in processed food including alcohol (from 1.5 percent to 2.0 percent), unprocessed food (from 0.3 percent to 3.3 percent), non-regulated energy products (from minus 11.0 percent to minus 10.2 percent) and in transport services (from 2.4 percent to 2.8 percent). Inflation also eased in recreational and personal care services.
Core inflation, excluding volatile items like energy and fresh food, was 1.8 percent, the same as in the previous month. Excluding just energy, the rate was 1.9 percent, up from 1.7 percent in September. The gap between goods and services shrank slightly in October.
The HICP, which, unlike the CPI, accounts for seasonal factors like summer sales, rose 0.3 percent monthly, down from 1.2 in September. The annual rate, however, rose to 1.0 percent, up from September's 0.7 percent.
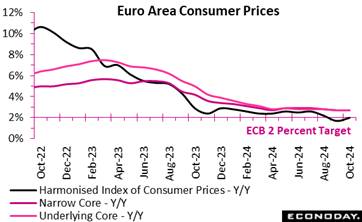 Inflation provisionally accelerated in October. A 0.3 percent monthly increase in prices was enough to lift the yearly rate from September's final 1.7 percent to 2.0 percent, a tick above the market consensus but only a 2-month high. Having fallen below it last month for the first time in more than three years, inflation now matches its 2.0 percent medium-term target. Inflation provisionally accelerated in October. A 0.3 percent monthly increase in prices was enough to lift the yearly rate from September's final 1.7 percent to 2.0 percent, a tick above the market consensus but only a 2-month high. Having fallen below it last month for the first time in more than three years, inflation now matches its 2.0 percent medium-term target.
The key core rates were better behaved, both the narrowest gauge and the measure excluding just energy and unprocessed food holding steady at 2.7 percent. Inflation in services was similarly steady at 3.9 percent while its non-energy industrial goods counterpart edged 0.1 percentage point higher to a still very soft 0.5 percent. Consequently, most of the boost to the overall rate came from energy (minus 4.6 percent after minus 6.1 percent) and food, alcohol and tobacco (2.9 percent after 2.4 percent).
Regionally, headline inflation rose only slightly in France (1.5 percent after 1.4 percent) and Spain (1.8 percent after 1.7 percent) but climbed much more sharply in both Italy (1.0 percent after 0.7 percent) and, in particular, Germany (2.4 percent after 1.8 percent) which moved back above the target rate.
The acceleration in Eurozone inflation this month will not come as a surprise to the ECB which had already warned of some upside potential through year-end. Consequently, it should not prevent another the cut in key interest rates in December. Even so, the October update may be firm enough to dampen some of the speculation about a full 50 basis point ease.
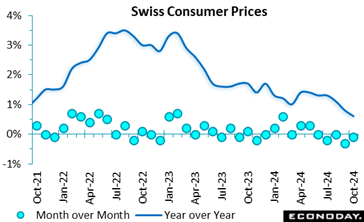 Consumer prices continued to surprise on the downside in October. A 0.1 percent monthly fall was enough to shave 0.2 percentage points off the yearly inflation rate which, at now just 0.6 percent, matches its weakest mark since April 2021. Consumer prices continued to surprise on the downside in October. A 0.1 percent monthly fall was enough to shave 0.2 percentage points off the yearly inflation rate which, at now just 0.6 percent, matches its weakest mark since April 2021.
The overall monthly drop reflected 0.1 percent declines in both domestic and import prices, the former reducing annual inflation from 2.0 percent to 1.8 percent and the latter from minus 2.7 percent to minus 3.1 percent.
Within the CPI basket, the main area of weakness was petroleum products where prices were down 2.1 percent versus September alongside food and soft drinks (minus 0.7 percent) and alcohol and tobacco (minus 0.5 percent). Declines here were sufficient to more than offset modest gains elsewhere. As a result, core prices rose just 0.1 percent, cutting the annual underlying inflation rate by a couple of ticks to 0.8 percent, equalling its lowest reading since November 2021.
Inflation remains within the SNB's definition of price stability but the ongoing decline in the core rate is becoming a real problem for the central bank and would seemingly guarantee another cut in the policy rate next month. Indeed, while already at just 1.0 percent, a 50 basis point move is looking increasingly possible.
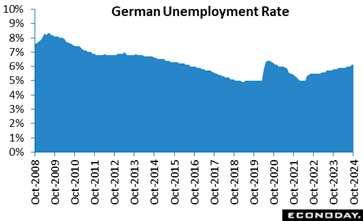 In October, Germany's labour market remained under strain, with the unemployment rate steady at 6.1 percent, aligning with the upwardly prior revised reading and consensus expectations. This figure marks the 22nd straight month of elevated unemployment, reflecting ongoing pressure on the labour market and a cautious hiring outlook among employers. Meanwhile, the number of unemployed individuals rose to 2.856 million from 2.823 million. In October, Germany's labour market remained under strain, with the unemployment rate steady at 6.1 percent, aligning with the upwardly prior revised reading and consensus expectations. This figure marks the 22nd straight month of elevated unemployment, reflecting ongoing pressure on the labour market and a cautious hiring outlook among employers. Meanwhile, the number of unemployed individuals rose to 2.856 million from 2.823 million.
However, job vacancies increased by 1,000, recovering the drop in September and at least tentatively pointing to some stabilisation ahead.
Nonetheless, current labour market conditions hint at a likely downturn in consumer spending and economic growth, as the ongoing rise in joblessness weakens household income and spending power.
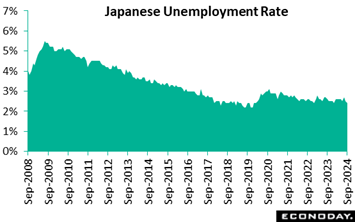 Japanese payrolls posted their 26th straight rise on year in September amid labor shortages. The unemployment rate improved further to an eight-month low of 2.4% after unexpectedly falling to 2.5% in August from 2.7% in July. It is lower the median economist forecast of 2.5%. Job losses and retirements fell a seasonally adjusted 5.1% on the month for the second straight drop and the number of people who began looking for work dipped 2.0% after rising the previous month. Those factors more than offset a 5.7% rise in the number of those who quit for better positions after a sharp drop in the prior month. Japanese payrolls posted their 26th straight rise on year in September amid labor shortages. The unemployment rate improved further to an eight-month low of 2.4% after unexpectedly falling to 2.5% in August from 2.7% in July. It is lower the median economist forecast of 2.5%. Job losses and retirements fell a seasonally adjusted 5.1% on the month for the second straight drop and the number of people who began looking for work dipped 2.0% after rising the previous month. Those factors more than offset a 5.7% rise in the number of those who quit for better positions after a sharp drop in the prior month.
Employment rose 270,000 on the year to 68.14 million in September after surging 420,000 in August. The number of unemployed fell 90,000 to 1.73 million after falling a sharp 110,000 for the first drop in five months. It was the lowest since 1.63 million recorded in January 2024.
The year-on-year job creation was led by the information telecommunications and manufacturing industries. The increase among the hotels and restaurants category slowed. Construction jobs were down after recent gains.
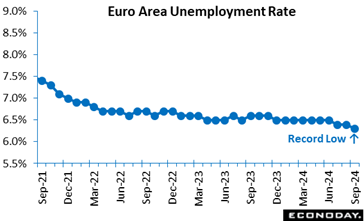 Joblessness rose 13,000 to 10.884 million in September. However, with August's fall being revised to a steeper 101,000 the increase only left the unemployment rate at the previous month's downwardly revised 6.3 percent, itself a new record low. The data show the labour market still tighter than expected. Joblessness rose 13,000 to 10.884 million in September. However, with August's fall being revised to a steeper 101,000 the increase only left the unemployment rate at the previous month's downwardly revised 6.3 percent, itself a new record low. The data show the labour market still tighter than expected.
Amongst the larger Eurozone countries, the national unemployment rate rose in France (7.6 percent after 7.5 percent) but was stable in both Germany (3.5 percent) and Italy (6.1 percent) and continued to decline in Spain (11.2 percent after 11.3 percent).
The latest labour market developments will probably leave at least some members on the ECB's General Council more cautious about lowering interest rates again this year. A 25 basis point cut remains probable in December but a larger ease now looks less likely and the focus on wages will be all the sharper
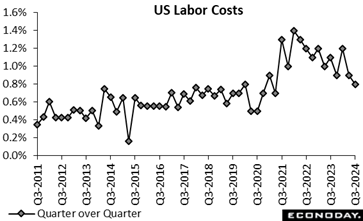 The ECI cooled again to a modest 0.8 percent rise in the third quarter from the second quarter while it was up 3.9 percent year on year, more good news for the Federal Reserve officials watching for easing wage pressures. The figures compared with expectations for 1.0 percent and 4.1 percent, respectively. The quarter-over-quarter gain is the smallest since up 0.7 percent in the second quarter 2021. The year-over-year increase is the smallest since up 3.7 percent in the third quarter 2021. While the upward trend for compensation has moderated significantly on an annual basis, increases are still above pre-pandemic levels. Competition for workers with the right skills and experience remains a factor in the labor market even as it has rebalanced to a more normal supply/demand situation. The ECI cooled again to a modest 0.8 percent rise in the third quarter from the second quarter while it was up 3.9 percent year on year, more good news for the Federal Reserve officials watching for easing wage pressures. The figures compared with expectations for 1.0 percent and 4.1 percent, respectively. The quarter-over-quarter gain is the smallest since up 0.7 percent in the second quarter 2021. The year-over-year increase is the smallest since up 3.7 percent in the third quarter 2021. While the upward trend for compensation has moderated significantly on an annual basis, increases are still above pre-pandemic levels. Competition for workers with the right skills and experience remains a factor in the labor market even as it has rebalanced to a more normal supply/demand situation.
In the third quarter, wages and salaries – about two-thirds of the compensation index -- are up 0.8 percent compared to the second quarter and up 3.9 percent year-over-year. Benefits costs are 0.8 percent higher compared to the prior quarter and up 3.7 percent year-over-year. Wages and salaries costs are coming down while increases for benefit are steadier over time.
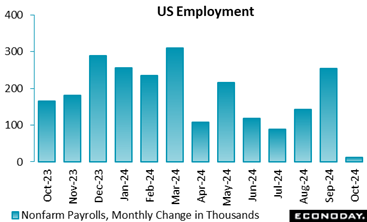 Nonfarm payrolls rise a scant 12,000 in October after a net downward revision of 112,000 in the prior two months. The October increase is well below the consensus of up 125,000 in the Econoday survey of forecasters. The BLS noted that Hurricane Milton fell within the survey reference period for October both the establishment and household surveys. Nonfarm payrolls rise a scant 12,000 in October after a net downward revision of 112,000 in the prior two months. The October increase is well below the consensus of up 125,000 in the Econoday survey of forecasters. The BLS noted that Hurricane Milton fell within the survey reference period for October both the establishment and household surveys.
 The BLS said, "The initial establishment survey collection rate for October was well below average. However, collection rates were similar in storm-affected areas and unaffected areas. A larger influence on the October collection rate for establishment data was the timing and length of the collection period. This period, which can range from 10 to 16 days, lasted 10 days in October and was completed several days before the end of the month." The BLS added, "It is likely that payroll employment estimates in some industries were affected by the hurricanes [both Helene in September and Milton in October]; however, it is not possible to quantify the net effect on the over-the-month change in national employment, hours, or earnings estimates because the establishment survey is not designed to isolate effects from extreme weather events. There was no discernible effect on the national unemployment rate from the household survey." The BLS said, "The initial establishment survey collection rate for October was well below average. However, collection rates were similar in storm-affected areas and unaffected areas. A larger influence on the October collection rate for establishment data was the timing and length of the collection period. This period, which can range from 10 to 16 days, lasted 10 days in October and was completed several days before the end of the month." The BLS added, "It is likely that payroll employment estimates in some industries were affected by the hurricanes [both Helene in September and Milton in October]; however, it is not possible to quantify the net effect on the over-the-month change in national employment, hours, or earnings estimates because the establishment survey is not designed to isolate effects from extreme weather events. There was no discernible effect on the national unemployment rate from the household survey."
While the hurricanes have undoubtedly had an impact on the October data, parsing out exactly what that is is difficult.
Private payrolls are down 28,000 in October. There is a 44,000 decrease in transportation equipment manufacturing that probably includes the impact from the Boeing strike which encompasses 38,000 workers. A dip of 6,000 in motor vehicles and parts may be related to the hurricanes that temporarily shut down some plants in the Southeast. Professional and business services are down 47,000 and mostly reflect a 48,400 in administrative and support and waste management and remediation services that could also be storm-related. There is an increase of 52,300 in health care that might include some emergency workers but is more likely due to general demand in the health care industry. The dip of 4,000 in leisure and hospitality that includes a new strike of 3,400 among hotel workers.
Government payrolls are up 40,000 in October with state government hiring up 18,000 and local government up 21,000. Some of this may be short-term workers to respond to regional emergency conditions.
Fed policymakers will probably reserve judgement as to whether the job gains have suddenly decelerated until they have another month or two of data to clarify if these are short-term weather impacts or a more fundamental shift.
In the meantime, average hourly earnings are up 0.4 percent in October from September and up 4.0 percent year-over-year. This is an indication that earnings gains are not losing much steam as yet even if the labor market is softer. The average workweek is unchanged at 34.3 in October.
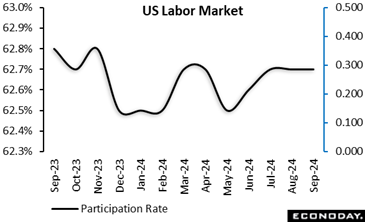
The unemployment rate is unchanged at 4.1 percent in October and the U-6 unemployment rate is also unchanged at 7.7 percent. The size of the labor force is down 220,000 with the number of unemployed up 150,000 and the number of employed down 368,000. A shrinking labor force in October brought the participation rate down a tenth to 62.6 percent. This does not suggest that the labor market is fundamentally weakening with labor supply tightening somewhat.
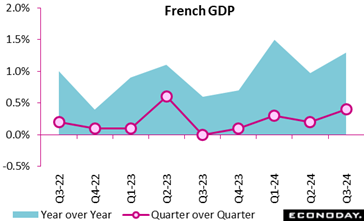 France's GDP growth accelerated modestly in the third quarter, increasing from 0.2 percent in the second quarter to 0.4 percent, within consensus range and largely due to the Paris Olympic and Paralympic Games. This increase was primarily fuelled by a 0.5 percent increase in household consumption, which contrasted with the stagnation of the previous quarter. Nevertheless, gross fixed capital formation continues to decline at minus 0.8 percent, indicating that investment remains weak. France's GDP growth accelerated modestly in the third quarter, increasing from 0.2 percent in the second quarter to 0.4 percent, within consensus range and largely due to the Paris Olympic and Paralympic Games. This increase was primarily fuelled by a 0.5 percent increase in household consumption, which contrasted with the stagnation of the previous quarter. Nevertheless, gross fixed capital formation continues to decline at minus 0.8 percent, indicating that investment remains weak.
Domestic demand (excluding inventories) contributed 0.2 percentage points to GDP growth, tripling its contribution in the second quarter. This suggests a gradual recovery in local economic activity. In contrast, foreign trade had a lesser positive impact of 0.1 point, as imports contracted faster than exports, alleviating trade pressures. Inventories provided a modest buffer to overall growth, contributing a marginal 0.1 points an increase from zero in the previous quarter.
While positive, the growth pattern of last quarter indicates only a tentative recovery. This recovery is primarily supported by event-driven consumption but is tempered by persistent investment instability and marginal trade and inventory contributions.
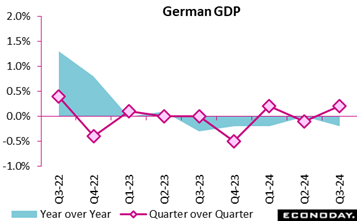 In the third quarter of 2024, Germany's GDP rose modestly by 0.2 percent from the previous quarter, well above the market consensus and aided by increased government and household spending. This follows a slight downward revision for Q2 to minus 0.2 percent from minus 0.1 percent, highlighting a very fragile economic trajectory. In the third quarter of 2024, Germany's GDP rose modestly by 0.2 percent from the previous quarter, well above the market consensus and aided by increased government and household spending. This follows a slight downward revision for Q2 to minus 0.2 percent from minus 0.1 percent, highlighting a very fragile economic trajectory.
Compared with the same period in 2023, and adjusting for both price and calendar effects, GDP slipped by 0.2 percent, in line with the consensus. However, when adjusted for price alone, the GDP showed a mild 0.2 percent rise.
While stronger than expected last quarter, the German economic recovery remains sluggish at best, reflecting in part broader fiscal adjustments and weak private demand.
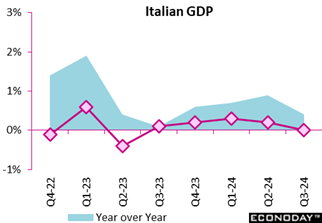 The Italian economy only remained steady in the third quarter, with the seasonally and calendar-adjusted GDP surprisingly showing no growth on the quarter, well short of market expectations. Total output was up 0.4 percent year-over-year. The flat quarterly performance reflected a decrease in agriculture, forestry and fishing offset by a positive contribution from services. The Italian economy only remained steady in the third quarter, with the seasonally and calendar-adjusted GDP surprisingly showing no growth on the quarter, well short of market expectations. Total output was up 0.4 percent year-over-year. The flat quarterly performance reflected a decrease in agriculture, forestry and fishing offset by a positive contribution from services.
The third quarter data are disappointingly soft although the absence of any GDP expenditure components makes it difficult to determine underlying trends.
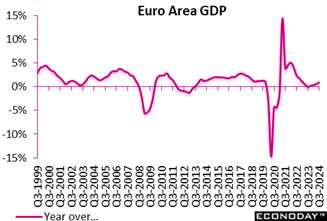 The preliminary flash data for the July-September period showed a surprisingly strong 0.4 percent quarterly rise in GDP, double both the market consensus and the unrevised second quarter rate. Annual growth was 0.9 percent, up from 0.6 percent previously. The preliminary flash data for the July-September period showed a surprisingly strong 0.4 percent quarterly rise in GDP, double both the market consensus and the unrevised second quarter rate. Annual growth was 0.9 percent, up from 0.6 percent previously.
Within the region's quarterly advance, France expanded 0.4 percent, in large part due to the effects of the Paris Olympics, and Spain a solid 0.8 percent, matching its second quarter gain. Germany surprised on the upside with a 0.2 percent rise, although this followed a weaker revised second quarter, while Italy disappointed as GDP only stagnated. Elsewhere, Ireland climbed fully 2.0 percent and Lithuania 1.1 percent but Latvia remained in recession with a 0.4 percent contraction. There were no other outright declines.
Lacking any expenditure components, the provisional headline third quarter data probably flatter to deceive and conceal another quarter of sluggish private sector domestic demand. In any event, they are not strong enough to undermine expectations for another cut in ECB interest rates in December.
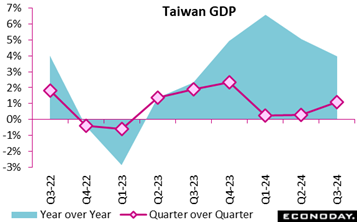 Advance estimates for Taiwan GDP show the economy gained momentum in the three months of September, increasing 1.08 percent on the quarter after an increase of 0.29 percent in the three months to June. In contrast, previously published industrial production and PMI survey data showed more subdued conditions in the manufacturing sector over the quarter. Advance estimates for Taiwan GDP show the economy gained momentum in the three months of September, increasing 1.08 percent on the quarter after an increase of 0.29 percent in the three months to June. In contrast, previously published industrial production and PMI survey data showed more subdued conditions in the manufacturing sector over the quarter.
GDP growth moderated in year-over-year terms, increasing 3.97 percent on the year in the three months to September after growth of 5.06 percent in the three months to June. This slowdown in year-over-year growth was largely driven by weaker growth in consumer spending and a bigger negative contribution of net exports to headline GDP growth. This was partly offset by stronger growth in investment and government spending.
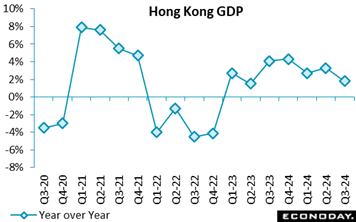 Hong Kong's economy weakened sharply on a quarter-over-quarter basis in the three months to September, with GDP contracting 1.1 percent after increasing 0.4 percent in the three months to June. Previously published PMI survey data also showed ongoing weakness in economic activity over the quarter, with PMI survey data for October scheduled for release next week. GDP also grew at a slower pace on the year, increasing 1.8 percent in the three months to September, down from growth of 3.3 percent previously. Hong Kong's economy weakened sharply on a quarter-over-quarter basis in the three months to September, with GDP contracting 1.1 percent after increasing 0.4 percent in the three months to June. Previously published PMI survey data also showed ongoing weakness in economic activity over the quarter, with PMI survey data for October scheduled for release next week. GDP also grew at a slower pace on the year, increasing 1.8 percent in the three months to September, down from growth of 3.3 percent previously.
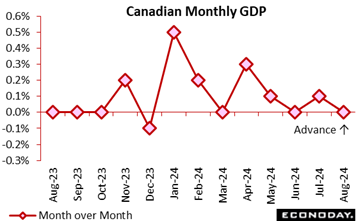 The Canadian economy was flat in August after a revised 0.1 percent rise in July. Expectations called for no change in August. Year over year, the economy expanded by 1.3 percent in August. The Canadian economy was flat in August after a revised 0.1 percent rise in July. Expectations called for no change in August. Year over year, the economy expanded by 1.3 percent in August.
Services rose 0.1 percent in August while goods-producing industry slipped by 0.4 percent to their lowest level since December 2021. Overall, 12 of 20 sectors grew in August.
The advance estimate for September points to a 0.3 percent rise.
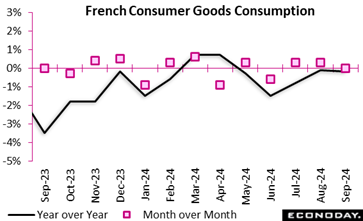 Household consumption of manufactured goods remained stable month-over-month, slowing from August's revised 0.4 percent increase, reflecting adjustments for seasonal patterns and newly available data. While engineered goods surged by 1.8 percent, driven by a sharp rise in clothing and durable goods spending, the gain was offset by a drop in food and energy consumption. Cooler weather boosted textile and clothing purchases, with spending on apparel climbing by 6.2 percent. Similarly, durable goods rebounded, with notable gains in housing equipment such as appliances and furniture. Household consumption of manufactured goods remained stable month-over-month, slowing from August's revised 0.4 percent increase, reflecting adjustments for seasonal patterns and newly available data. While engineered goods surged by 1.8 percent, driven by a sharp rise in clothing and durable goods spending, the gain was offset by a drop in food and energy consumption. Cooler weather boosted textile and clothing purchases, with spending on apparel climbing by 6.2 percent. Similarly, durable goods rebounded, with notable gains in housing equipment such as appliances and furniture.
Over the third quarter, total consumption of goods modestly rebounded by 0.3 percent after a decline in Q2. Engineered goods remained stable across the quarter, while food consumption saw a slight recovery, climbing 0.3 percent. Energy consumption rose by 0.9 percent, spurred by higher electricity and gas spending despite lower fuel use.
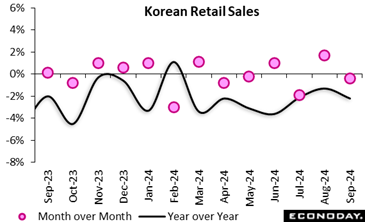 South Korea's retail sales index fell 0.4 percent on the month in September after increasing 1.7 percent in August. On the year, the index declined 2.2 percent after falling 1.3 percent previously. Sales of consumer durables rose 2.9 percent on the year after falling 4.7 percent previously. South Korea's retail sales index fell 0.4 percent on the month in September after increasing 1.7 percent in August. On the year, the index declined 2.2 percent after falling 1.3 percent previously. Sales of consumer durables rose 2.9 percent on the year after falling 4.7 percent previously.
Officials also published a separate report on sales for 25 large retailers. This showed solid but less pronounced year-over-year growth of 6.7 percent in September, down from 9.2 percent in August. Food, home appliances and online sales were strong, outweighing weakness in other categories.
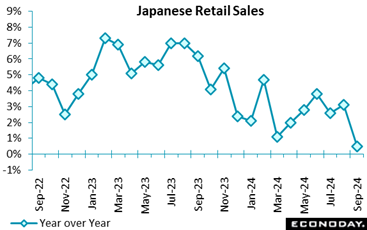 Japanese retail sales posted a slight 0.5% gain on the year in September after rising an upwardly revised 3.1% in August. It was much weaker than the consensus call of a 1.7% increase. On the month, retail sales plunged 2.3% for the first drop in six months after rising an upwardly revised 1.0% in the prior month. July-September sales slowed to a 1.1% increase on quarter after a 1.8% rise in April-June. Japanese retail sales posted a slight 0.5% gain on the year in September after rising an upwardly revised 3.1% in August. It was much weaker than the consensus call of a 1.7% increase. On the month, retail sales plunged 2.3% for the first drop in six months after rising an upwardly revised 1.0% in the prior month. July-September sales slowed to a 1.1% increase on quarter after a 1.8% rise in April-June.
The three-month moving average of the seasonally adjusted index of retail sales fell 0.3% in September after many months of gains, prompting the Ministry of Economy, Trade and Industry to downgrade its assessment, saying retail sales are "taking one step forward and one step back." Previously, it had said sales were "on an uptrend."
The slight year-on-year increase in retail sales was led by a sharp rise in clothing as the protracted heat wave shored up demand for summer clothing but the hot and humid weather also hurt sales of autumn clothing and other seasonal goods, pushing down combined sales at department stores and supermarkets to record a slight drop. Auto sales posted their second straight drop on year and fuels marked their first fall in three months on lower prices.
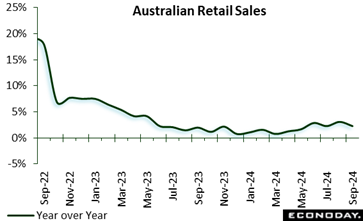 Retail sales in Australia rose 0.1 percent on the month in September after an increase of 0.7 percent in August, with year-over-year growth steady at 2.3 percent. Performance was mixed on a regional basis, with sales a little stronger than the national average in the most populous state, New South Wales, but weaker in the next two most populous states, Victoria and Queensland. Household goods retailers and cafe and restaurants recorded sales increases stronger than the headline increase, offset by a fall in sales of food and clothing and by department stores. Retail sales in Australia rose 0.1 percent on the month in September after an increase of 0.7 percent in August, with year-over-year growth steady at 2.3 percent. Performance was mixed on a regional basis, with sales a little stronger than the national average in the most populous state, New South Wales, but weaker in the next two most populous states, Victoria and Queensland. Household goods retailers and cafe and restaurants recorded sales increases stronger than the headline increase, offset by a fall in sales of food and clothing and by department stores.
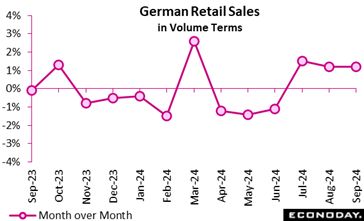 In September, Germany's retail sector showed promising growth, with real sales climbing by 1.2 percent month-over-month, well above the market consensus, and 3.8 percent year-over-year. The nominal increase of 0.6 percent month-over-month, hints at declining mineral oil prices, easing inflationary pressure and enhancing consumer purchasing power. Yearly comparisons reveal robust growth, particularly notable as September 2023 and February 2024 marked historic lows since 2021. In September, Germany's retail sector showed promising growth, with real sales climbing by 1.2 percent month-over-month, well above the market consensus, and 3.8 percent year-over-year. The nominal increase of 0.6 percent month-over-month, hints at declining mineral oil prices, easing inflationary pressure and enhancing consumer purchasing power. Yearly comparisons reveal robust growth, particularly notable as September 2023 and February 2024 marked historic lows since 2021.
Food retail sales showed a minor monthly decline of 0.8 percent in real terms, but a yearly uptick of 0.3 percent. Non-food sectors performed better, rising by 1.7 percent monthly and 6.1 percent yearly, indicating increased consumer interest in non-essentials. Online and mail-order retail sales surged significantly, with a monthly gain of 3.1 percent and an impressive 17.9 percent year-over-year gain, suggesting a shift towards convenience shopping.
These results collectively underscore a gradual recovery, with consumers favouring online platforms and non-essential goods, perhaps reflecting increasing consumer confidence and economic resilience.
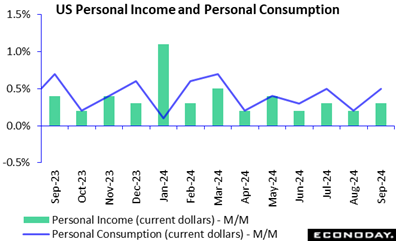 Personal income is up 0.3 percent in September after August and up 0.2 percent in August from July. The increase is slightly below the consensus of up 0.4 percent in the Econoday survey of forecasters. Wages and salaries are up 0.5 percent month-over-month in September and August. Proprietors' income with inventory valuation and capital consumption adjustments is down 0.4 percent in September due to a drop of 25.4 percent in farm while nonfarm is up a scant 0.1 percent. Personal income is up 0.3 percent in September after August and up 0.2 percent in August from July. The increase is slightly below the consensus of up 0.4 percent in the Econoday survey of forecasters. Wages and salaries are up 0.5 percent month-over-month in September and August. Proprietors' income with inventory valuation and capital consumption adjustments is down 0.4 percent in September due to a drop of 25.4 percent in farm while nonfarm is up a scant 0.1 percent.
Interest income is down 0.7 percent while dividend income is up 0.3 percent. While overall government benefits income is up 0.4 percent, it is notable that unemployment insurance is down 0.8 percent which suggests fewer people on unemployment rolls.
Personal consumption expenditures are up 0.5 percent in September from August and up 0.3 percent in August from July. The September increase is slightly above the consensus of up 0.4 percent in the Econoday survey of forecasters. In September, spending is up 0.8 percent for durables, up 0.4 percent for nondurables, and up 0.5 percent for services. Durables and nondurables are higher after declines in the prior month while spending on services remains about on trend.
The PCE deflator is up 0.2 percent month-over-month in September and up 2.1 percent year-over-year. This matches the consensus for each in the Econoday survey. The core PCE deflator is up 0.3 percent from the prior month and up 2.7 percent compared to September 2023. The monthly increase matches the consensus in the Econoday survey while the year-over-year increase is a tenth above the median forecast.
The PCE deflator is the preferred measure of inflation for the FOMC. This report is the last piece of the inflation puzzle – along with the third quarter employment cost index – that Fed policymakers will have in hand when they meet on Wednesday and Thursday, November 6-7. While the annual increase in the PCE deflator suggests that inflation is aligning with the Fed's 2 percent inflation objective, the core PCE deflator remains relatively elevated and is a little higher than the prior month. The FOMC will not overreact to what looks like stalled disinflation at the core price level but it will not disregard that some aspects of upward price pressures persist
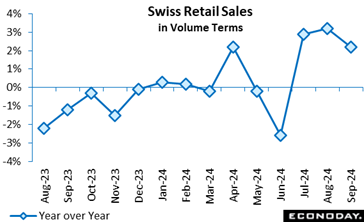 Retail sales were soft in September. A 0.5 percent monthly fall in volumes was the first setback since June and followed a smaller revised 0.1 percent gain in August. Annual growth slowed from 2.7 percent to 2.2 percent, a 3-month low and 0.3 percentage points below the market consensus. Retail sales were soft in September. A 0.5 percent monthly fall in volumes was the first setback since June and followed a smaller revised 0.1 percent gain in August. Annual growth slowed from 2.7 percent to 2.2 percent, a 3-month low and 0.3 percentage points below the market consensus.
September's monthly dip was attributable to a 1.8 percent drop in purchases of food, drink and tobacco and a 1.2 percent slide in auto fuel. Losses here masked a 1.0 percent advance in non-food sales (excluding auto fuel) that followed a 0.5 percent decrease in August.
Despite September's dip, today's update puts total third quarter sales 1.4 percent above their second quarter level making for a positive contribution from the sector to quarterly real GDP growth.
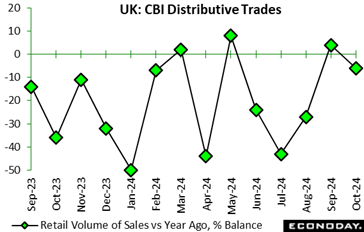 The latest CBI distributive trades survey reveals a subdued retail market as consumer caution impacts sales volumes. October saw a modest decline in retail sales, contrasting with the slight growth in September. This fall is largely attributed to consumer hesitation amid uncertainty surrounding the upcoming Autumn Budget. Retailers anticipate that sales will remain flat next month, reflecting a muted outlook. The latest CBI distributive trades survey reveals a subdued retail market as consumer caution impacts sales volumes. October saw a modest decline in retail sales, contrasting with the slight growth in September. This fall is largely attributed to consumer hesitation amid uncertainty surrounding the upcoming Autumn Budget. Retailers anticipate that sales will remain flat next month, reflecting a muted outlook.
Seasonal sales disappointments were reported, with October's levels far below expectations (minus 25 percent), a trend likely to persist into November. While in-store sales fell, online sales continued to strengthen, with a steady rise of 21 percent, and projections suggest further growth next month.
Additionally, retailers are cutting back on supplier orders, reflecting decreased consumer demand, which is expected to dip further in November. The broader distribution sector, including wholesale and motor trades, similarly recorded a moderate decline in annual sales volumes, likely to continue as we approach the year's end. These trends indicate a challenging landscape for retailers, where only online channels appear resilient amidst prevailing consumer uncertainties.
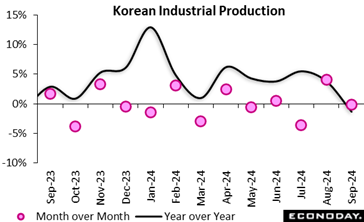 South Korea's index of industrial production fell 0.2 percent on the month in September after surging 4.1 percent in August, with the index falling 1.3 percent on the year after a previous increase of 3.8 percent. Within the industrial sector, manufacturing output fell 0.1 percent on the month after a previous increase of 4.4 percent, with year-over-year growth weakening from an increase of 3.7 percent to a decline of 1.4 percent. Previously published PMI survey data also showed conditions in the manufacturing sector deteriorated sharply in September, with data for October due to be published later this week. South Korea's index of industrial production fell 0.2 percent on the month in September after surging 4.1 percent in August, with the index falling 1.3 percent on the year after a previous increase of 3.8 percent. Within the industrial sector, manufacturing output fell 0.1 percent on the month after a previous increase of 4.4 percent, with year-over-year growth weakening from an increase of 3.7 percent to a decline of 1.4 percent. Previously published PMI survey data also showed conditions in the manufacturing sector deteriorated sharply in September, with data for October due to be published later this week.
Activity was mixed in other sectors. Service sector output fell 0.7 percent on the month in September after increasing 0.3 percent in August, while construction sector activity contracted at a slower pace, down 0.1 percent after a previous decline of 1.9 percent. Output in the public administration sector rebounded sharply with an increase of 2.6 percent after a previous decline of 1.1 percent. Aggregating across all sectors, output fell 0.3 percent on the month after a previous increase of 1.3 percent, with output falling 1.1 percent on the year after a previous increase of 1.3 percent.
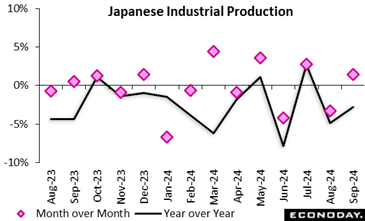 Japan's industrial production rebounded a modest 1.4% on the month in September, coming in firmer than the median economist forecast of a 0.8% gain and following a 3.3% slump in August and a 3.1% rise in July. The increase was in line with a rebound in real exports and due largely to the auto industry as Toyota Motor had resumed output of some models suspended earlier amid a false safety record scandal. Japan's industrial production rebounded a modest 1.4% on the month in September, coming in firmer than the median economist forecast of a 0.8% gain and following a 3.3% slump in August and a 3.1% rise in July. The increase was in line with a rebound in real exports and due largely to the auto industry as Toyota Motor had resumed output of some models suspended earlier amid a false safety record scandal.
METI said 10 out of the 15 industries showed gains, led by passenger cars, chemicals (phenol, polyethylene) and air conditioners whose demand remained strong amid the protracted heat wave that scorched many parts of Japan.
METI's survey of producers indicated that output is expected to rise a solid 5.1% in October, led by manufacturers of production machinery and transport equipment, before falling 3.7% in November on expected lower production of production machinery and semiconductors.
In the July-September quarter, industrial production fell 0.4% on quarter after rising 2.7% in April-June and plunging 5.2% in January-March. In the first two months of the year, suspended output at Toyota group firms over a safety test scandal triggered a widespread slump beyond the auto industry, hurting consumption and business investment and leading to the first GDP contraction in two quarters.
Third-quarter capital goods shipments (excluding transport equipment) slumped 3.9% on quarter after rising 0.5% in the second quarter and falling 2.0% in the first quarter, indicating business investment in equipment in the Q3 GDP data due on Nov. 15 may be sluggish.
From a year earlier, factory output fell 2.8%, smaller than the consensus call of a 3.4% drop and following a deeper-than-expected 4.9% slump in August and a 2.9% rebound in July.
The ministry maintained its assessment, saying industrial output is "taking one step forward and one step back." It said it will keep a close watch on how global economic growth evolves.
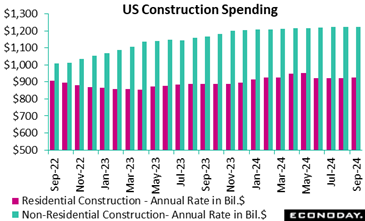 The dollar value of construction put in place is up 0.1 percent month-over-month in September after up 0.1 percent in August. The increase matches the consensus in the Econoday survey of forecasters. Construction s pending is up 4.6 percent year-over-year. Total residential spending is up 0.1 percent and nonresidential is up 0.2 percent. The dollar value of construction put in place is up 0.1 percent month-over-month in September after up 0.1 percent in August. The increase matches the consensus in the Econoday survey of forecasters. Construction s pending is up 4.6 percent year-over-year. Total residential spending is up 0.1 percent and nonresidential is up 0.2 percent.
Total private residential construction is up 0.2 percent in September from August and up 4.1 percent from September 2023. Spending on new single-family homes is up 0.4 percent in September and up 0.9 percent year-over-year, while spending on multi-unit projects is down 0.1 percent from the prior month and down 8.1 percent compared to September 2023. Spending on home improvement – total private residential spending less single- and multi- unit homes – is unchanged in September but up 13.5 percent from a year ago.
Total private nonresidential spending is down 0.1 percent in September from August but up 3.5 percent year-over-year. All significant categories of nonresidential spending are down in September.
Total public construction is up 0.5 percent in September from the prior month and up 7.0 percent from September 2023. The two largest categories of public construction both rose in September. Spending on highway and street construction is up 0.5 percent month-over-month and up 1.7 percent year-over-year. Education building is up 0.3 percent month-over-month and up 3.9 percent year-over-year.
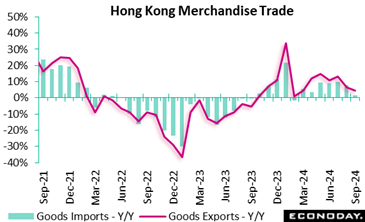
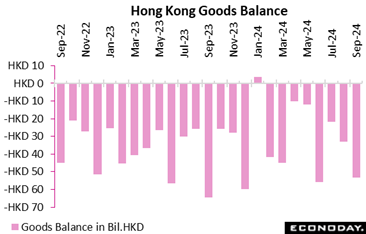
Hong Kong's merchandise trade deficit widened from HK$33.1 billion in August to HK$53.2 billion in September. Exports rose 4.7 percent on the year in September after advancing 6.4 percent in August, while imports rose 1.4 percent after a previous increase of 7.9 percent. Officials noted further mixed growth in exports to major trading partners in September but expressed optimism that improved prospects for the Chinese economy should provide support to external demand.
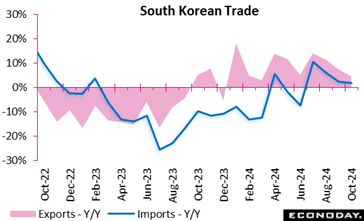 South Korea's trade surplus narrowed from $6.66 billion in September to $3.17 billion in October. Exports rose 4.6 percent on the year after increasing 7.5 percent previously, while imports advanced 1.7 percent on the year after a previous increase of 2.2 percent. South Korea's trade surplus narrowed from $6.66 billion in September to $3.17 billion in October. Exports rose 4.6 percent on the year after increasing 7.5 percent previously, while imports advanced 1.7 percent on the year after a previous increase of 2.2 percent.
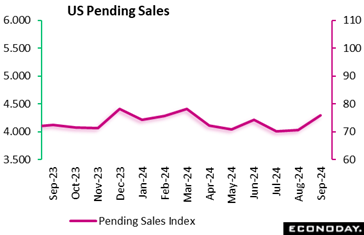 The NAR's pending home sales index jumps 7.4 percent to 75.8 in September after an unrevised 70.6 in the prior month. The change is well above the consensus of up 1.0 percent in the Econoday survey of forecasters. The index is 2.6 percent higher than a year ago. The NAR's pending home sales index jumps 7.4 percent to 75.8 in September after an unrevised 70.6 in the prior month. The change is well above the consensus of up 1.0 percent in the Econoday survey of forecasters. The index is 2.6 percent higher than a year ago.
The dip in mortgage rates brought homebuyers into the market while they could lock in a favorable rate. The Freddie Mac rate for a 30-year fixed rate mortgage hit lows not seen in two years at 6.08 percent in the September 26 week. Along with more inventory and greater negotiating power on price and terms, contract signings increase across the country as buyers locked in rates before these went up again.
The pending home sales index by region shows an increase of 6.5 percent in the Northeast, 7.1 percent in the Midwest, 6.7 percent in the South, and 9.8 percent in the West.
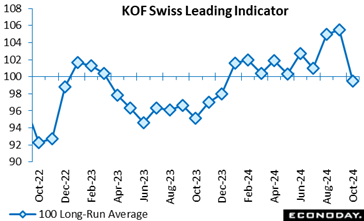 The leading indicator fell surprisingly sharply at the start of the quarter. At 99.5, the gauge was more than 5 points short of the market consensus and recorded its first sub-100 outturn so far in 2024. The October reading also followed a weaker revised 104.5 in September. The leading indicator fell surprisingly sharply at the start of the quarter. At 99.5, the gauge was more than 5 points short of the market consensus and recorded its first sub-100 outturn so far in 2024. The October reading also followed a weaker revised 104.5 in September.
Manufacturing, financial and insurance services, other services, hospitality and the construction sector all lost ground while both domestic and foreign demand were broadly stable. Within manufacturing, the outlook deteriorated significantly for chemical and pharmaceutical companies, the metal industry, the wood, glass, stone and earth segment and for food and beverage producers.
In sum, October's disappointingly soft report suggests that near-term GDP growth will be a little less than average which, if correct, would further increase the chances of another cut in the SNB policy rate in December. To this end, today's update trims the Swiss RPI to minus 14 and the RPI-P to 5, the gap between the two measures showing downside surprises concentrated in the inflation data.
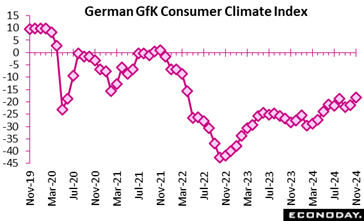 At minus 18.3, up from a marginally firmer revised minus 21.0 in October, GfK expects its consumer climate index to hits its highest level in November since April 2022. The outcome was stronger than the market consensus. Increased consumer willingness to buy and improved income expectations are key factors in addition to a decrease in willingness to save and an increase in optimistic income expectations. At minus 18.3, up from a marginally firmer revised minus 21.0 in October, GfK expects its consumer climate index to hits its highest level in November since April 2022. The outcome was stronger than the market consensus. Increased consumer willingness to buy and improved income expectations are key factors in addition to a decrease in willingness to save and an increase in optimistic income expectations.
Nevertheless, consumers remain pessimistic about the outlook with their economic expectations worsening for the third consecutive month to 0.2 points. The government's GDP forecast for the year indicates a 0.2 percent contraction, which has exacerbated economic concerns.
Sentiment remains fragile, despite the slight increase in consumer confidence making a sustained and meaningful recovery in the consumer spending unlikely for now.
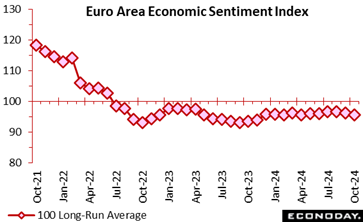 Economic sentiment unexpectedly deteriorated at the start of the quarter. October's headline index fell 0.7 points from a marginally firmer revised 96.3 in September to 95.6, also 0.7 points short of the market consensus. This was its weakest reading since February and so further below its 100 long-run average. Economic sentiment unexpectedly deteriorated at the start of the quarter. October's headline index fell 0.7 points from a marginally firmer revised 96.3 in September to 95.6, also 0.7 points short of the market consensus. This was its weakest reading since February and so further below its 100 long-run average.
At a sector level, confidence worsened quite sharply in industry (minus 13.0 after minus 11.0). However, there were gains in retail (minus 7.3 after minus 8.3), construction (minus 4.9 after minus 5.5) and in the household sector (minus 12.5 after minus 12.9). Services (7.1) were unchanged.
Regionally, national sentiment weakened significantly in both France (93.6 after 98.3) and Spain (102.4 after 107.2) and also deteriorated in Italy (99.5 after 100.0). Germany (90.2 after 89.4) was the only member of the larger four economy group to post a rise, albeit from an already weak level, and just Spain is now above the common 100 historic mean.
Inflation expectations rose. Hence, expected selling prices were up slightly in manufacturing (6.5 after 6.3) and more notably in services (14.0 after 12.3). In addition, inflation expectations in the consumer sector (13.3 after 11.0) also increased, hitting their highest mark since March.
The October update increases the likelihood that superficially respectable third quarter GDP growth will not be repeated in the current period. The ECB remains on course to ease again in December although with inflation expectations up across the board, market talk of a possible 50 basis point cut is likely to be tempered somewhat.
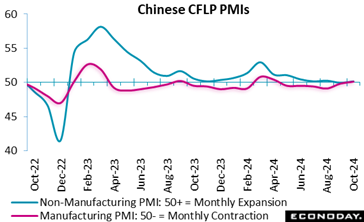 Official Chinese PMI survey data show moderate growth in China's aggregate economy in October. The headline index for the CFLP manufacturing PMI rose from 49.8 to 50.1, just above the consensus forecast of 50.0 and indicating expansion in the sector for the first time in six months, albeit barely. The CFLP non-manufacturing PMI rose from 50.0 to 50.2, below the consensus forecast of 50.4 and also indicating close to zero growth in the sector. The composite index covering the entire economy rose from 50.4 in September to 50.8 in October. Official Chinese PMI survey data show moderate growth in China's aggregate economy in October. The headline index for the CFLP manufacturing PMI rose from 49.8 to 50.1, just above the consensus forecast of 50.0 and indicating expansion in the sector for the first time in six months, albeit barely. The CFLP non-manufacturing PMI rose from 50.0 to 50.2, below the consensus forecast of 50.4 and also indicating close to zero growth in the sector. The composite index covering the entire economy rose from 50.4 in September to 50.8 in October.
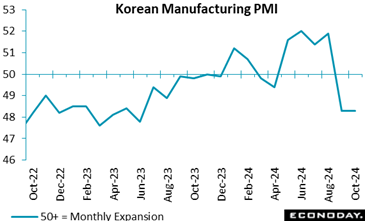 South Korea's manufacturing PMI showed a second consecutive month of contraction in the sector in October after four consecutive months of expansion, with the survey's headline index unchanged at a 13-month low of 48.3. Respondents reported weaker current conditions and more subdued price pressures and also have little confidence about the outlook. South Korea's manufacturing PMI showed a second consecutive month of contraction in the sector in October after four consecutive months of expansion, with the survey's headline index unchanged at a 13-month low of 48.3. Respondents reported weaker current conditions and more subdued price pressures and also have little confidence about the outlook.
Survey respondents reported declines in output, new orders and new export orders in October. Respondents also steady payrolls after a previous decline and expect below-average output growth over the next 12 months. The survey shows the smallest increase in input costs in more than a year and a second consecutive decline in selling prices.
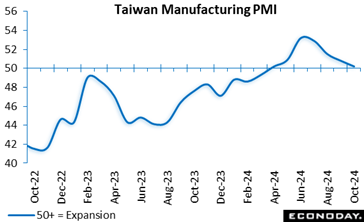 Taiwan's manufacturing PMI shows the sector expanded for the seventh consecutive month but at a slower pace in October, with its headline index falling to 50.2 from 50.8 in September. Respondents reported solid external demand but more subdued domestic conditions and are only slightly more confident about the outlook for output growth over the next 12 months. Taiwan's manufacturing PMI shows the sector expanded for the seventh consecutive month but at a slower pace in October, with its headline index falling to 50.2 from 50.8 in September. Respondents reported solid external demand but more subdued domestic conditions and are only slightly more confident about the outlook for output growth over the next 12 months.
Survey respondents reported output and new orders grew at only a marginal pace in October, with the former recording the slowest growth in the current seven-month run of expansion. New export orders, however, were reported to have risen for the fifth month in a row, reflecting solid demand from Europe and the United States. The survey showed a reduction in payrolls, while its measure of business confidence picked up slightly but remains close to its lowest level so far this year. Respondents reported a bigger increase in input costs and a modest increase in selling prices.
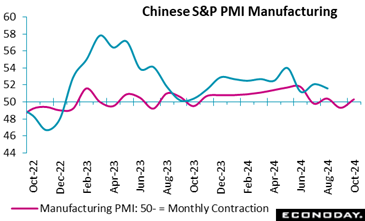 The S&P Global China manufacturing PMI showed another month of weak conditions in the sector in October, with the headline index advancing to 50.3 from 49.3 in September, indicating only very modest growth. Official PMI survey published earlier in the week also showed that conditions in the sector remained subdued in October. The S&P Global China manufacturing PMI showed another month of weak conditions in the sector in October, with the headline index advancing to 50.3 from 49.3 in September, indicating only very modest growth. Official PMI survey published earlier in the week also showed that conditions in the sector remained subdued in October.
Respondents to the S&P PMI survey reported output and new orders rose modestly in October but at the fastest pace in four months, new export orders reported to have fallen at a less pronounced pace. Payrolls were reported to have been cut more sharply, but the survey's measure of business confidence rose to a five-month high. The survey also shows input costs and selling prices both rose in October after falling in September.
Today's data were weaker than the consensus forecast of 49.7 for the manufacturing sector survey's headline index.
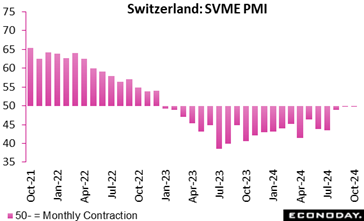 The SVME PMI held steady in October. At 49.9, the latest reading matched the September print and beat the market consensus by 0.2 points. The index duly remains just short of the 50-growth threshold and essentially in line with stagnation in the manufacturing sector. The SVME PMI held steady in October. At 49.9, the latest reading matched the September print and beat the market consensus by 0.2 points. The index duly remains just short of the 50-growth threshold and essentially in line with stagnation in the manufacturing sector.
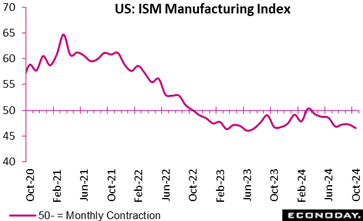 The US manufacturing sector remained in contraction for a seventh straight month in October and the pace of decline unexpectedly accelerated, the latest monthly data from the Institute for Supply Management showed. The US manufacturing sector remained in contraction for a seventh straight month in October and the pace of decline unexpectedly accelerated, the latest monthly data from the Institute for Supply Management showed.
The sector index compiled by the ISM, which indicates general direction, fell to 46.5 in October from 47.2 in September and 47.2 in August. The latest reading came in well below the median economist forecast of 47.6.
ISM said the latest result shows ongoing weakness in demand with production slowing in response.
Markets are on election-watch as global data beat expectations.
Politics may dominate activity in financial markets this week, but the data remains key to monetary policy and five major central banks will be making policy announcements. At 23, Econoday’s Relative Economic Performance Index (RPI) shows recent global economic activity moving ahead of forecasts but only after almost three months of sustained underperformance. As such, with inflation trends in general still headed south, many central banks remain poised to ease further.
In the U.S., following a messy, but probably soft October employment update, and just ahead of Tuesday’s presidential election and Thursday’s FOMC announcement, the RPI stands at minus 1 and the RPI-P at 4. Accordingly, the latest data show overall economic activity running pretty much as expected and leaves a high likelihood of a 25 basis point cut by the Federal Reserve this week.
In Canada, zero economic growth in August was in line with forecasts but the RPI (minus 20) and RPI-P (minus 13) both still slipped further below zero. On current trends, another cut in Bank of Canada interest rates in December remains firmly on the cards.
In the Eurozone, the RPI (22) and RPI-P (12) crept further into positive surprise territory, in part reflecting a slightly firmer than forecast flash October inflation report. An ECB interest rate cut next month still seems very probable, but a full 50 basis point move now looks rather less likely.
In the UK, mainly second tier data saw the RPI slip to minus 34 and the RPI-P to minus 16. Overall economic activity is falling somewhat short of expectations and mainly due to surprisingly weak prices – the ideal combination for a cut in Bank Rate this week.
In Switzerland, Friday’s deluge of surprisingly weak data saw the RPI slide to minus 28 and the RPI-P drop to minus 20. With core inflation increasingly in danger of falling below zero, the Swiss National Bank would seem to have little choice but to ease policy yet again in December.
In Japan, a very mixed suite of data saw the RPI and RPI-P close out the week at 6 and minus 7 respectively, essentially showing economic activity in general matching market expectations. The unchanged decision from the central bank was widely expected but on current trends another hike in interest rates in December is at least a possibility, especially should upcoming inflation reports surprise on the upside.
Meantime, fresh signs of life in the Chinese economy lifted both the RPI and RPI-P to 64, their highest readings since the end of March and offering early, but only very tentative, signs that the latest stimulus packages might work.
**Contributing to this article were Jeremy Hawkins, Brian Jackson, Mace News, Max Sato, Olajide Oyadeyi, and Theresa Sheehan
There is nothing on the week’s data calendar that will distract from two big events.
First, the US presidential election will be held on Tuesday, November 5. Most predictions are for a close race that might not be completely settled until after localities count their absentee and provisional ballots. This could take several days. That won’t stop news outlets and/or campaigns from declaring a winner, or at least a likely winner.
Second, the FOMC meets on Wednesday and Thursday to deliberate on US monetary policy. Proximity to the election will tinge perceptions of whatever decision is released at 14:00 ET on Thursday. Chair Jerome Powell’s press briefing at 14:30 ET on Thursday may be an exercise in defending the independence of the central bank and its officials’ determination to set politically unbiased policy according to the available data and information. It is probable that Powell will get questions about his future as Chair of the Fed which he will gracefully brush aside as inappropriate to talk about.
The FOMC is highly unlikely to deliver another 50-basis point cut like it did on September 18. Expectations are widely for a 25-basis point cut to bring the fed funds target rate down a notch from the present 4.75-5.00 percent range.
On the maximum employment side of the Fed’s dual mandate, the October employment report will muddy the outlook. The downside surprise of payrolls up 12,000 in October compared to the median market forecast of about 125,000 was a shock on the face of it. However, other reports on payrolls and layoff activity suggest that the headline is more due to special factors than a sudden deceleration in hiring. The fact that the unemployment rate remained at 4.1 percent and that the participation rate was down a tenth to 62.6 percent should be convincing evidence that the underlying conditions are healthy.
On the price stability side, the Fed’s preferred measure of inflation is the PCE deflator. As of September, the overall PCE deflator shows prices up 2.1 percent year-over-year. While that looks great and might be a reason to declare victory in this inflationary episode, the core PCE deflator is up 2.7 percent in September and has been essentially the same since May. The PCE deflator for goods-only is down 1.2 percent year-over-year in September while services prices are up 3.7 percent compared to a year ago. In services, housing and utilities costs are up 4.9 percent from September 2023. This makes it difficult to pronounce inflation has been tamed.
Inflation expectations for the medium term remain above the 2 percent target, but are otherwise well-anchored.
Taken together, in an economy experiencing moderate growth, there is room to cut rates a little more, but no urgency. With the US economy continuing to expand above the Fed’s longer-run forecast of up 1.8 percent, making the case that adding in some stimulus via easier monetary policy is the right move could be tougher, the October payroll headline notwithstanding. There won’t be an update to the FOMC’s quarterly summary of economic projections at the November 6-7 meeting. It will be up to the meeting statement and Powell’s briefing to signal the next steps ahead. One thing is sure to be emphasized, that policymakers are data-dependent and that decisions will be on a meeting-by-meeting basis.
Globally the PMI manufacturing finals for France, Germany and the eurozone area are to be released on Monday, all of which are estimated to be below the 50-growth threshold, suggesting manufacturing will continue to contract.
Australia is also to announce its inflation target this week with the Reserve Bank of Australia expected to keep rates on hold till next year. No change expected this time from 4.35 percent for the official cash rate.
US jobless claims are estimated to move back to 225,000 after dipping to 216,000 in the previous week with current strikes and weather causing the spike.
After the latest drop in UK inflation to 1.7 percent in September, forecasters uniformly expect the Bank of England to announce another 25-basis point rate cut Thursday, pulling down the rate to 4.75 percent.
US Motor Vehicle Sales for October (Mon 1000 EST; Mon 1500 GMT)
Consensus Forecast, Total Vehicle Sale - Annual Rate: 15.7 M
Consensus Range, Total Vehicle Sale - Annual Rate: 14.9 M to 16.0 M
Forecasters see vehicle sales essentially flat at a 15.7 million unit rate in October versus 15.8 million in September.
France PMI Manufacturing Final for October (Mon 0950 CEST; Mon 0850 GMT; Mon 0350 EST)
Consensus Forecast, Index: 44.5
Consensus Range, Index: 44.5 to 44.5
Forecasters look for no change in the final index reading from 44.5 in the flash.
Germany PMI Manufacturing Final for October (Mon 0955 CEST; Mon 0855 GMT; Mon 0355 EST)
Consensus Forecast, Index: 42.6
Consensus Range, Index: 42.6 to 42.6
No change from the flash 42.6 reading is the call for the German PMI manufacturing final.
Eurozone PMI Manufacturing Final for October (Mon 1000 CET; Mon 0900 GMT; Mon 0400 EST)
Consensus Forecast, Index: 45.9
Consensus Range, Index: 45.9 to 45.9
Forecasters look for no change in the final index reading from 45.9 in the flash.
US Factory Orders for September (Mon 1000 EST; Mon 1500 GMT)
Consensus Forecast, M/M: -0.5%
Consensus Range, M/M: -0.9% to -0.3%
As evidenced in the gloomy ISM reports, manufacturing business has been contracting and forecasters look for no let-up in September. Expectations call for a decline of 0.5 percent.
South Korea CPI for October (Tue 0800 KST; Mon 2300 GMT; Mon 1800 EST)
Consensus Forecast, CPI - M/M: 0.3%
Consensus Range, CPI - M/M: 0.2% to 0.3%
Consensus Forecast, CPI - Y/Y: 1.4%
Consensus Range, CPI - Y/Y: 1.4% to 1.4%
Consumer price inflation remains muted with CPI expected to show a 0.3 percent rise in October from September while the CPI is expected up 1.4 percent on year after September’s 1.6 percent increase.
China PMI Composite for October (Tue 0945 CST; Tue 0145 GMT; Mon 2045 EST)
Consensus Forecast, Composite Index: 50.4
Consensus Range, Composite Index: 50.4 to 50.4
Consensus Forecast, Services Index: 50.5
Consensus Range, Services Index: 50.5 to 50.5
Expectations for China composite PMI call for a marginal rise to 50.4 in October from 50.3 in September. Services PMI should also improve to 50.5 in October from 50.3 in September.
Australia RBA Announcement (Tue 1430 AET; Tue 0330 GMT; Mon 2230 EST)
Consensus Forecast, Change: 0 bp
Consensus Range, Change: 0 bp to 0 bp
Consensus Forecast, Level: 4.35%
Consensus Range, Level: 4.35% to 4.35%
Inflation has come down nicely but forecasters look for the RBA to keep rates on hold until early next year. No change seen this time from 4.35 percent for the official cash rate.
Switzerland Unemployment Rate for October (Tue 0745 CET; Tue 0645 GMT; Tue 0145 EST)
Consensus Forecast, Adjusted: 2.6%
Consensus Range, Adjusted: 2.6% to 2.6%
Forecasters see no change in the jobless rate at 2.6% in October.
UK PMI Composite Final for October (Tue 0500 GMT; Tue 0430 EST)
Consensus Forecast, Composite Index: 51.7
Consensus Range, Composite Index: 51.7 to 51.7
Consensus Forecast, Services Index: 51.8
Consensus Range, Services Index: 51.8 to 51.8
No change from the flash is expected for the composite at 51.7 and for services at 51.8.
Canada Merchandise Trade for September (Tue 0830 EST; Tue 1330 GMT)
Consensus Forecast, Balance: -C$0.5 B
Consensus Range, Balance: -C$1.3 B to C$0.3 B
A weak showing for exports and rising imports have kept Canada’s merchandise trade balance in deficit lately. A deficit of C$0.5 billion is the call for September after August’s C$1.1 billion deficit.
US International Trade in Goods and Services for September (Tue 0830 EST; Tue 1330 GMT)
Consensus Forecast, Balance: -$82.0 B
Consensus Range, Balance: -$87.9 B to -$71.9 B
After a much wider than expected merchandise trade deficit for September in the advance report,
forecasters look for the goods and services trade gap to widen notably to $82.0 billion in September from $70.4 billion in August.
US ISM Services Index for October (Tue 1000 EST; Tue 1500 GMT)
Consensus Forecast, Index: 53.5
Consensus Range, Index: 53.0 to 55.8
The services sector has been holding up remarkably well relative to manufacturing, with a nice expansion continuing. Forecasters still expect the ISM services index to recede to 53.5 in October after a surprising uptick to 54.9 in September from 51.5 in August.
New Zealand Labour Market Conditions for Q3 (Wed 1145 NZDT; Tue 2245 GMT; Tue 1745 EST)
Consensus Forecast, Employment - Q/Q: -0.5%
Consensus Range, Employment - Q/Q: -0.6% to -0.5%
Consensus Forecast, Unemployment Rate: 5.0%
Consensus Range, Unemployment Rate: 5.0% to 5.0%
Consensus Forecast, Labour Market Cost Index - Q/Q: 0.7%
Consensus Range, Labour Market Cost Index - Q/Q: 0.7% to 0.7%
Economists see increasing slack in the employment market with the jobless rate rising to 5.0 percent in Q3 from 4.6 percent in Q2. Slow growth in employment is seen turning to actual losses in Q3 with the employment index down 0.5 percent after rising 0.4 percent in Q2. Employment cost increases are slowing too with the cost index seen up 0.7 percent on the quarter, down from 0.9 percent in Q2.
Germany Manufacturing Orders for September (Wed 0800 CET; Wed 0700 GMT; Wed 0200 EST)
Consensus Forecast, M/M: 1.5%
Consensus Range, M/M: 1% to 2%
Forecasters expect orders to bounce back by 1.5 percent in September on the month after a nasty 5.8 percent plunge in August.
Germany PMI Composite Final for October (Wed 0955 CET; Wed 0855 GMT; Wed 0355 EST)
Consensus Forecast, Composite Index: 48.4
Consensus Range, Composite Index: 48.4 to 48.4
Consensus Forecast, Services Index: 51.4
Consensus Range, Services Index: 51.4 to 51.4
Forecasters see the composite final unchanged from 48.4 in the flash. Services are also seen steady in the final reading for October from 51.4 in the flash.
Eurozone PMI Composite Final for October (Wed 1000 CET; Wed 0900 GMT; Wed 0400 EST)
Consensus Forecast, Composite Index: 49.7
Consensus Range, Composite Index: 49.7 to 49.7
Consensus Forecast, Services Index: 51.2
Consensus Range, Services Index: 51.2 to 51.2
Forecasters see the composite final unchanged from 49.7 in the flash. Services are also seen steady at 51.2 from the flash in the final reading for October.
Eurozone PPI for September (Wed 1100 CET; Wed 1000 GMT; Wed 0500 EST)
Consensus Forecast, Y/Y: -3.4%
Consensus Range, Y/Y: -3.7% to -3.3%
Deflation in wholesale prices continues in the Eurozone with a 3.4 percent drop in PPI expected for September from a year ago.
Australia International Trade in Goods for September (Thu 1130 AET; Thu 0030 GMT; Wed 1930 EST)
Consensus Forecast, Balance: A$5.4 B
Consensus Range, Balance: A$4.5 B to A$6.0 B
The merchandise trade surplus is expected flat to slightly lower at A$5.4 billion in September from $5.6 billion in August.
Germany Industrial Production for September (Thu 0800 CET; Thu 0700 GMT; Thu 0200 EST)
Consensus Forecast, M/M: -0.5%
Consensus Range, M/M: -0.7% to 1.4%
Forecasts call for industrial production to fall back by 0.5 percent in September on the month after a 2.9 percent rise in August.
Germany Merchandise Trade for September (Thu 0800 CET; Thu 0700 GMT; Thu 0200 EST)
Consensus Forecast, Balance: E19.0 B
Consensus Range, Balance: E18.0 B to E24 B
The consensus forecast looks for the trade surplus to decline to E19.0 billion in September from E22.5 billion in August.
Eurozone Retail Sales for September (Thu 1100 CET; Thu 1000 GMT; Thu 0500 EST)
Consensus Forecast, Y/Y: 1.3%
Consensus Range, Y/Y: 0.6% to 1.5%
Retail sales are seen rising a decent 1.3 percent on year in September after a 0.8 percent rise in August.
UK BoE Announcement & Minutes (Thu 1100 GMT; Thu 0600 EST)
Consensus Forecast, Bank Rate - Change: -25 bp
Consensus Range, Bank Rate - Change: -25 bp to -25 bp
Consensus Forecast, Bank Rate - Level: 4.75%
Consensus Range, Bank Rate - Level: 4.75% to 4.75%
After the latest drop in UK inflation to 1.7 percent in September, forecasters uniformly expect another 25 basis point rate cut this week. Markets will watch for any comments on the latest government budget.
US Jobless Claims (Thu 0830 EST; Thu 1330 GMT)
Consensus Forecast, Initial Claims - Level: 225,000
Consensus Range, Initial Claims - Level: 220,000 to 235,000
Forecasters see weekly claims moving back to 225,000 after a surprising dip to 216,000 in the previous week. The numbers have been noisy owing to strike and weather effects.
US Productivity and Costs for Q3 (Thu 0830 EST; Thu 1330 GMT)
Consensus Forecast, Nonfarm Productivity - Annual Rate: 2.4%
Consensus Range, Nonfarm Productivity - Annual Rate: 2.3% to 3.3%
Consensus Forecast, Unit Labor Costs - Annual Rate: 0.9%
Consensus Range, Unit Labor Costs - Annual Rate: 0.5% to 2.8%
The initial release for Q3 is expected to show productivity rose at a 2.4 percent rate in the quarter versus 2.5 percent in Q2. Unit labor costs are seen up at a 0.9 percent rate versus 0.4 percent in Q2.
US FOMC Announcement (Thu 1400 EST; Thu 1900 GMT)
Consensus Forecast, Change: -25 bp
Consensus Range, Change: -25 bp to -25 bp
Consensus Forecast, Federal Funds Rate – Target Range: 4.50% to 4.75%
Consensus Range, Federal Funds Rate – Target Range: 4.50% to 4.75%
Even with a mostly resilient economic performance, the consensus view remains that the Fed sees US financial conditions as tighter than necessary to keep inflation headed down toward target. Forecasters see the Fed on track for another 25 basis point rate cut this week.
US Consumer Credit for September (Thu 1500 EST; Thu 2000 GMT)
Consensus Forecast, M/M: $13.3 B
Consensus Range, M/M: $7.9 B to $15.0 B
Forecasters see consumer credit up $13.3 billion on the month in September.
Canada Labour Force Survey for October (Fri 0830 EST; Fri 1330 GMT)
Consensus Forecast, Employment - M/M: 25,000
Consensus Range, Employment - M/M: 15,000 to 39,000
Consensus Forecast, Unemployment Rate: 6.6%
Consensus Range, Unemployment Rate: 6.5% to 6.7%
Canada’s economy continues to struggle with the jobless rate expected to tick up to 6.6 percent in October from 6.5 percent in September. Job growth is expected to remain anemic at 25,000.
US Consumer Sentiment for November (Fri 1000 EST; Fri 1500 GMT)
Consensus Forecast - Index: 70.8
Consensus Range, Index: 68.6 to 73.5
The preliminary consumer sentiment reading for November is expected to continue edging up after rising for three straight months. The consensus looks for 70.8, up from 70.5 in October.
|

