|
The October data for the CPI suggests that disinflation may have reached a plateau as commodities cost declines moderate while services prices remain slow to respond to restrictive monetary policy. The all-items CPI is up 2.6 percent year-over-year in October, somewhat faster than up 2.4 percent in September. The core CPI is up 3.3 percent compared to a year ago, the same as in September. One month’s worth of data is not definitive. It is too soon to say that the FOMC might reconsider a rate cut at the December 17-18 meeting, but it does suggest that the outlook for further rate cuts could see a slower pace of easing in monetary policy.
Retail and food services sales presented a mixed picture for October. Much of the report’s solid increase of 0.4 percent from September was concentrated in a 1.6 percent rise in motor vehicle sales. Excluding motor vehicles, sales are up only 0.1 percent month-over-month. In the background is that the September numbers had a big upward revision. It appears that late back-to-school spending and/or purchases in the wake of Hurricane Helene brought sales into September and exhausted a lot of demand in October.
 The final October consumer price index report confirmed a marked pick-up in in headline inflation. The yearly rate rose to 2.0 percent, well above September's final 1.6 percent albeit in line with its flash estimate. Food prices were pivotal, with a notable 2.3 percent increase year-over-year, driven by sharp rises in the cost of butter by 39.7 percent and olive oil by 28.1 percent. Energy prices, while still lower than a year ago (minus 5.5 percent), showed signs of slowing decline, suggesting a complex interplay between energy and overall inflation. The final October consumer price index report confirmed a marked pick-up in in headline inflation. The yearly rate rose to 2.0 percent, well above September's final 1.6 percent albeit in line with its flash estimate. Food prices were pivotal, with a notable 2.3 percent increase year-over-year, driven by sharp rises in the cost of butter by 39.7 percent and olive oil by 28.1 percent. Energy prices, while still lower than a year ago (minus 5.5 percent), showed signs of slowing decline, suggesting a complex interplay between energy and overall inflation.
Core inflation, excluding food and energy, stood at 2.9 percent, up from September's 2.7 percent and underscoring persistent inflationary pressures in services. Service prices rose 4.0 percent year-over-year, highlighting steep increases in insurance services (15.2 percent) and catering services (6.8 percent). Goods prices showed a modest uptick (0.4 percent), with non-alcoholic beverages (6.8 percent) standing out.
Month-over-month, consumer prices rose an unrevised 0.4 percent, propelled by increased costs for energy (0.4 percent) and food (0.8 percent). Butter prices surged (9.9 percent), with a significant drop in sugar prices (minus 19.9 percent).
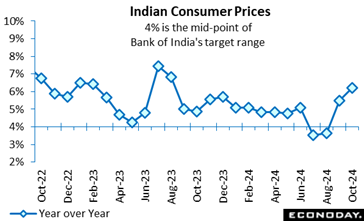 India's consumer price index rose 6.21 percent on the year in October, picking up from an increase of 5.49 percent in September. This is the biggest increase since August 2023 and pushes headline inflation above the Reserve Bank of India's target range of two percent to six percent. India's consumer price index rose 6.21 percent on the year in October, picking up from an increase of 5.49 percent in September. This is the biggest increase since August 2023 and pushes headline inflation above the Reserve Bank of India's target range of two percent to six percent.
The move higher in headline inflation was driven by food prices. Food and beverage prices rose 9.69 percent on the year, up from the 8.36 percent increase recorded previously, while fuel and light charges fell at a slightly more pronounced rate, down 1.61 percent on the year after a previous decline of 1.39 percent. Inflation in urban areas rose from 5.05 percent in September to 5.62 percent in October, while inflation in rural areas accelerated from 5.87 percent to 6.68 percent.
At the RBI's most recent policy meeting, held last month, officials left policy rates on hold at 6.50 percent. Officials noted then that they expect base effects may send inflation higher in the near-term. They also advised that they are shifting their policy stance from "the withdrawal of accommodation" to "neutral". This, they judge, will provide them with greater flexibility in upcoming meetings while enabling them to continue monitoring the path of disinflation. They also repeated their earlier pledge to remain focused on achieving "a durable alignment of the headline CPI inflation with the target".
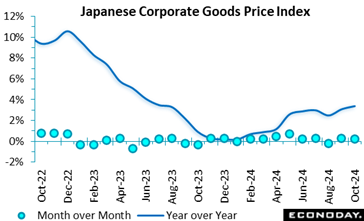 Producer inflation in Japan surged to a 14-month high of 3.4% in October from an upwardly revised 3.1% (vs. an initial +2.8%) in September amid a spike in farm produce costs (+26.0% vs. +18.0%) caused by rare and acute domestic rice shortages. The 3.4% increase is the highest since +3.5% in August 2023. Producer inflation in Japan surged to a 14-month high of 3.4% in October from an upwardly revised 3.1% (vs. an initial +2.8%) in September amid a spike in farm produce costs (+26.0% vs. +18.0%) caused by rare and acute domestic rice shortages. The 3.4% increase is the highest since +3.5% in August 2023.
The much higher than expected rise in the corporate goods price index (vs. the median forecast of a 3.0% gain) was also led by non-ferrous metals (+14.6% vs. +9.7%) and petroleum/coal products (+4.5% vs. +1.5%). Some energy and commodities markets picked up on heightened tensions between Israel and Iran.
The government temporarily revived subsidies utility subsides cap energy costs during Japan's dangerously hot summer and warm autumn (through October bills), leading to a slower 5.6% increase in utilities in October from a 7.9% gain in September, but that didn't have much impact on the overall rise in business costs. Mild downward pressures were also seen in lumber/wood (-1.5% vs. -0.9%) and chemicals (-0.6% vs. +0.3%) as Chinese demand remains sluggish.
On the month, the CGPI rose 0.2% after rising 0,3% (revised up from being unchanged) and falling 0.2% in August, marking the 11th rise in 12 months. It was much firmer than a 0.1% drop, on a further rise in the prices of farm produce (polished ride, brown rice and chicken eggs) as the rice shortages lingered. The increase was also due to higher costs for non-ferrous metals (copper), metals (steelworks, locks) and transport equipment (chassis). The prices for fuels, utilities and chemicals were down.
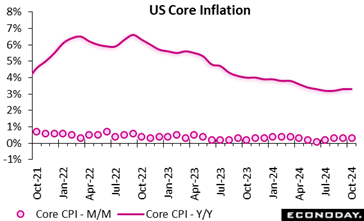 The October consumer price index (CPI) is up 0.2 percent month-over-month and up 2.6 percent year-over-year. This matches the consensus in the Econoday survey of forecasters. The October core CPI – excluding food and energy – is up 0.3 percent from the prior month and up 3.3 percent compared to a year ago. This also matches the survey consensus. The October consumer price index (CPI) is up 0.2 percent month-over-month and up 2.6 percent year-over-year. This matches the consensus in the Econoday survey of forecasters. The October core CPI – excluding food and energy – is up 0.3 percent from the prior month and up 3.3 percent compared to a year ago. This also matches the survey consensus.
The CPI annual increases suggest that the pace of disinflation may have stalled again. As noted above, the CPI annual increase is 2.6 percent, which is above the up 2.4 percent in September and up 2.5 percent in August. The core CPI year-over-year increase of 3.3 percent is the same as in September and slightly higher than up 3.2 percent in September.
Some of this may be due to a deceleration in the improvement in commodities prices which had powered rapid disinflation from the peaks in mid-2022. Supply chains have healed and fundamentals are reasserting themselves. In October, the commodities price index is unchanged from the prior month and down 1.0 percent year-over-year. The services index is not decelerating. The services index is up 0.4 percent in October from September and in line with recent readings. The year-over-year increase is 4.7 percent, the same as in September.
Prices for food and beverages are up 0.2 percent month-over-month is October and up 2.1 percent year-over-year. Energy prices are unchanged in October from September and down 4.9 percent from a year ago.
Shelter costs have kept the index for services elevated and account for about 1/3 of the overall CPI basket. The shelter index is up 0.4 percent in October from September and up 4.9 percent compared to October 2023. The special aggregate index for services less rent of shelter is up 0.4 percent month-over-month in October and up 4.5 percent year-over-year.
The CPI excluding food, energy, and shelter is up 0.2 percent in October from September and up 2.1 percent compared to October 2023. This indicates that upward price pressure has eased for many categories, but not necessarily for the three most critical to households and which have a big effect on discretionary spending decisions.
Fed policymakers will have one more CPI report on Wednesday, December 11 at 8:30 ET before the FOMC meeting on Tuesday and Wednesday, December 17 and 18. At the moment the inflation data does not change the outlook for another rate cut in December. However, the FOMC is data-dependent and on a meeting-by-meeting basis. The FOMC might pause in this early rate cut cycle if participants are more concerned about the risks to price stability.
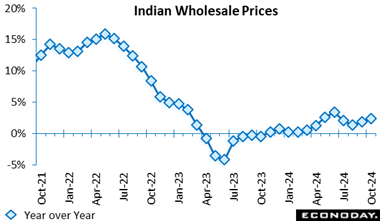 India's wholesale price index rose 2.36 percent on the year in October after increasing 1.84 percent in September. Data released earlier in the week also showed an increase in consumer price inflation in October. India's wholesale price index rose 2.36 percent on the year in October after increasing 1.84 percent in September. Data released earlier in the week also showed an increase in consumer price inflation in October.
As with CPI inflation, the bigger year-over-year increase in wholesale prices in October was partly driven by food prices, which account for around 15 percent of the index and are often volatile. These rose 11.59 percent on the year after increasing 9.47 percent previously. Manufacturing prices, around 64 percent of the index, also contributed to higher headline inflation, increasing 1.50 percent on the year after a previous increase of 1.00 percent. Fuel prices, around 13 percent of the index, fell 5.79 percent on the year, weakening further from the previous decline of 4.05 percent.
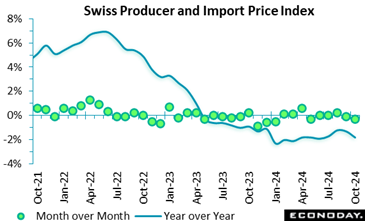 The combined producer and import price index unexpectedly fell again in October. Following a 0.1 percent monthly dip in September, the headline index dropped 0.3 percent, reducing the annual inflation rate from minus 1.3 percent to minus 1.8 percent, a 4-month low. The combined producer and import price index unexpectedly fell again in October. Following a 0.1 percent monthly dip in September, the headline index dropped 0.3 percent, reducing the annual inflation rate from minus 1.3 percent to minus 1.8 percent, a 4-month low.
Domestic prices also declined 0.3 percent, trimming their yearly rate from minus 0.2 percent to minus 0.5 percent. Import prices were down a steeper 0.4 percent, lowering their annual rate from minus 3.4 percent to minus 4.4 percent.
Within the PPI, the main monthly falls were posted by petroleum products (3.1 percent) and information and electronic and optical products (1.1 percent). Import prices were similarly driven lower mainly by petroleum which slumped a further 4.8 percent. As a result, total core prices also dropped a monthly 0.3 percent, reducing the annual underlying rate from minus 0.8 percent to minus 1.1 percent.
Pipeline price pressures remain very soft, and this update will further boost speculation about another cut in the SNB's policy rate in December.
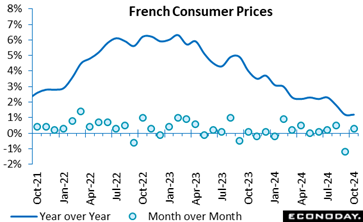 The CPI rose by 0.3 percent in October, following a 1.2 percent increase in September. The month-over-month inflation numbers were driven by services prices which rose by 0.2 percent. Also, energy prices increased by 0.8 percent, while food prices grew modestly by 0.2 percent, with fresh products up by 2.3 percent. The CPI rose by 0.3 percent in October, following a 1.2 percent increase in September. The month-over-month inflation numbers were driven by services prices which rose by 0.2 percent. Also, energy prices increased by 0.8 percent, while food prices grew modestly by 0.2 percent, with fresh products up by 2.3 percent.
Year-over-year, CPI increased by 1.2 percent, reflecting stabilised inflation. Furthermore, year-over-year, core inflation remained steady at 1.4 percent. Energy prices fell by 2.0 percent year-over-year, with petroleum product prices dropping less sharply. Conversely, gas prices surged by 10.7 percent, while electricity rose by 9.0 percent. Service price growth slowed to 2.3 percent, with reduced growth in vehicle maintenance, social protection, and catering services, but accelerated in insurance and accommodation services. Manufactured product prices fell slightly by 0.2 percent year-over-year, with notable declines in major household appliances and health products. Food prices increased by 0.6 percent annually, with fresh vegetables driving the rise, despite slower growth in fresh fruits and fish.
The harmonised index of consumer prices also increased by 0.3 percent monthly and 1.6 percent annually, showing a slight acceleration from September.
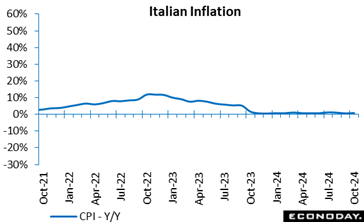 October's final consumer prices were unrevised. An unchanged monthly reading lifted annual inflation to 0.9 percent, up from September final 0.7 percent. The increase here was primarily due to higher rates in processed food including alcohol (from 1.5 percent to 1.7 percent), unprocessed food (from 0.3 percent to 3.4 percent), non-regulated energy products (from minus 11.0 percent to minus 10.2 percent) and in transport services (from 2.4 percent to 3.0 percent). Inflation also eased in recreational and personal care services. October's final consumer prices were unrevised. An unchanged monthly reading lifted annual inflation to 0.9 percent, up from September final 0.7 percent. The increase here was primarily due to higher rates in processed food including alcohol (from 1.5 percent to 1.7 percent), unprocessed food (from 0.3 percent to 3.4 percent), non-regulated energy products (from minus 11.0 percent to minus 10.2 percent) and in transport services (from 2.4 percent to 3.0 percent). Inflation also eased in recreational and personal care services.
Core inflation, excluding volatile items like energy and fresh food, was also unrevised at 1.8 percent, the same as in the previous month. Excluding just energy, the rate was 1.9 percent, up from 1.7 percent in September. The gap between goods and services shrank slightly in October.
The HICP, which, unlike the CPI, accounts for seasonal factors like summer sales, rose 0.3 percent monthly, similarly matching its flash estimate. The annual rate was 1.0 percent, up from September's 0.7 percent.
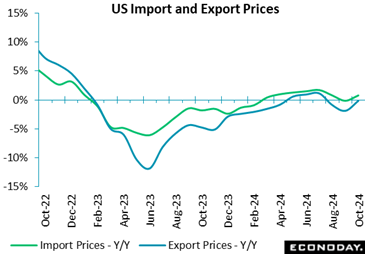 Prices for U.S. imports rose 0.3 percent in October following a 0.4-percent drop the previous month, against expectations of a 0.1 percent decline in the Econoday survey of forecasters - underscoring that inflation embers continue to burn. Prices for U.S. imports rose 0.3 percent in October following a 0.4-percent drop the previous month, against expectations of a 0.1 percent decline in the Econoday survey of forecasters - underscoring that inflation embers continue to burn.
The BLS said higher nonfuel and fuel prices contributed to October’s increase.
October's rise in import prices was the largest 1-month increase since a 0.9-percent jump in April and follows declines in September and August (-0.3 percent). U.S. import prices increased 0.8 percent compared to October 2023.
Prices for imported fuel rose 1.5 percent in October, after a 7.5-percent decline in September, but plunged 13.6 percent compared to a year ago.
Nonfuel import prices increased 0.2 percent for the second straight month in October. "Higher prices for nonfuel industrial supplies and materials, capital goods, consumer goods, and automotive vehicles in October more than offset lower foods, feeds, and beverages prices," the BLS said.
Prices for nonfuel imports rose 2.3 percent over the past year, the largest 12-month increase since October 2022.
The prices for U.S. exports rose 0.8 percent in October, after decreasing 0.6 percent the previous month. Despite the October rise, U.S. export prices dipped 0.1 percent over the past year.
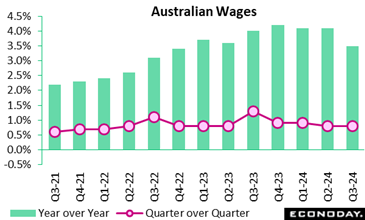 Australia's wage price index rose 0.8 percent on the quarter in the three months to September, as id did in the three months to June, with year-over-year growth in the index slowing from 4.1 percent to 3.5 percent. This is the slowest year-over-year growth since late 2022. Monthly labour market data over that period showed ongoing low unemployment rates and participation rates close to record highs. Australia's wage price index rose 0.8 percent on the quarter in the three months to September, as id did in the three months to June, with year-over-year growth in the index slowing from 4.1 percent to 3.5 percent. This is the slowest year-over-year growth since late 2022. Monthly labour market data over that period showed ongoing low unemployment rates and participation rates close to record highs.
Today's data are in line with the assessment made by officials at the Reserve Bank of Australia in their most recent quarterly update published last week. They noted that wages growth is moderating but also cautioned that it is still too high relative to productivity growth and represents an upside risk to inflation. Officials left policy rates on hold again last week but stressed that policy "will need to be sufficiently restrictive until the Board is confident that inflation is moving sustainably towards the target range".
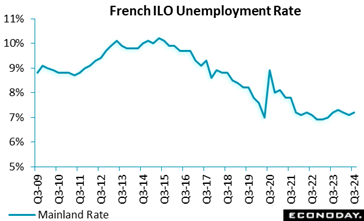 The third quarter mainland unemployment rate edged a tick higher to 7.2 percent, its first increase since the fourth quarter of last year but in line with the market consensus. The overall rate similarly rose 0.1 percentage point to 7.4 percent but remained well below its peak of 10.5 percent in the second quarter of 2015. The third quarter mainland unemployment rate edged a tick higher to 7.2 percent, its first increase since the fourth quarter of last year but in line with the market consensus. The overall rate similarly rose 0.1 percentage point to 7.4 percent but remained well below its peak of 10.5 percent in the second quarter of 2015.
Total joblessness was up 35,000 on the quarter, reaching 2.333 million. The youth unemployment rate (15-24 years) surged by 1.8 points to 19.7 percent, while unemployment among older workers (50+) decreased from 5.0 percent to 4.7 percent, its lowest mark since the second quarter of 2020.
The "halo" around unemployment - people who want a job but are not actively seeking - declined by 89,000 while long-term unemployment remained stable at 1.7 percent of the labour force.
The employment rate for people aged 15-64 increased slightly to 69.1 percent, its highest level since records began in 1975. Notably, the employment rate for those aged 50-64 rose sharply to 68.8 percent. The share of part-time workers remained stable, while underemployment hit its lowest point since 1992 at 4.3 percent. Promisingly, the permanent employment rate climbed to 51.1 percent, marking its highest level since 2003.
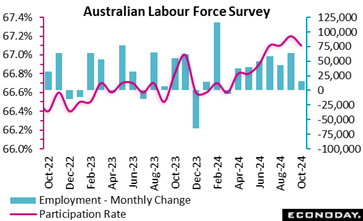 Labour market conditions in Australia moderated but remained solid in October, with employment increasing for the seventh consecutive month and the unemployment and participation rates continuing to indicate very tight conditions. This will likely keep the focus of the Reserve Bank of Australia on risks to the inflation outlook. Labour market conditions in Australia moderated but remained solid in October, with employment increasing for the seventh consecutive month and the unemployment and participation rates continuing to indicate very tight conditions. This will likely keep the focus of the Reserve Bank of Australia on risks to the inflation outlook.
The number of people employed in Australia rose by 15,900 in October, down from the increase of 64,100 in September and below the consensus forecast for an increase of 25,000. Full-time employment rose by 9,700 persons after a previous increase of 51,600 persons, while part-time employment rose by 6,200 persons after a previous increase of 12,500 persons. Hours worked rose 0.1 percent on the month after a previous increase of 0.3 percent.
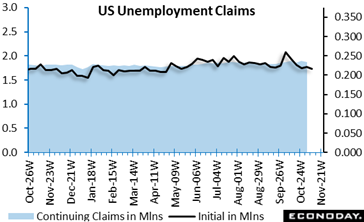 Initial jobless claims declined in the latest week, down 4,000 in the week ending November 9 following no revision to the 221,000-level reported for the prior week. The November 9 week's level is below the consensus of 225,000 in the Econoday survey of forecasters. The four-week moving average is down 6,250 to 221,000 in the November 9 week, after an unrevised 227,250 in the prior week. Initial jobless claims declined in the latest week, down 4,000 in the week ending November 9 following no revision to the 221,000-level reported for the prior week. The November 9 week's level is below the consensus of 225,000 in the Econoday survey of forecasters. The four-week moving average is down 6,250 to 221,000 in the November 9 week, after an unrevised 227,250 in the prior week.
The volatility in the initial claims data continues, making it an unreliable gauge of the labor market's current health. Seasonal factors had expected a large rise in unadjusted claims of 20,788 (almost 10 percent) from the previous week.
There was a noticeable jump in first-time claims filed in California, Minnesota, New Jersey and New York, while Michigan saw the largest decline.
Insured unemployment is down 11,000 in the November 2 week to 1.87 million, after a downwardly revised 1.884 million in the prior week – but continuing claims are up 66,000 from the same week a year ago, a sign of softness in the labor market. The four-week moving average is up 1,000 to 1.875 million, after an downwardly revised 1.874 million in the October 26 week.
The insured rate of unemployment remains steady at 1.2 percent in the November 2 week and has seen almost no variation since March 2023.
The up-and-down nature of recent initial jobless claims data has reduced its reliability as a labor market indicator, but the elevated number of those who continue to receive unemployment benefits compared to a year ago underscores the difficulty in finding new employment. This data point will be supportive of the Federal Open Market Committee's expected decision to cut rates again in December.
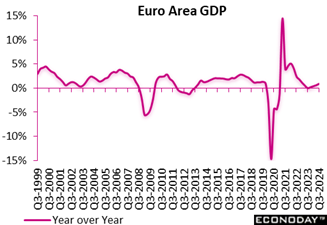 The preliminary flash data for the July-September period were unrevised, leaving a 0.4 percent quarterly rise in GDP and a 0.9 percent yearly increase. The quarterly gain was double the second quarter pace and represented the region's best performance in two years but will have been biased up by a boost from the Paris Olympics. The preliminary flash data for the July-September period were unrevised, leaving a 0.4 percent quarterly rise in GDP and a 0.9 percent yearly increase. The quarterly gain was double the second quarter pace and represented the region's best performance in two years but will have been biased up by a boost from the Paris Olympics.
Within the region's quarterly advance, France expanded an unrevised 0.4 percent, but is expected by the national central bank to show no growth at all this quarter, and Spain climbed a solid 0.8 percent. Germany also matched its 0.2 percent preliminary flash reading as did Italy which stagnated. Elsewhere, Ireland grew fully 2.0 percent and Lithuania 1.1 percent but Latvia remained in recession with a 0.4 percent contraction. There were no other outright declines.
Prospects for the current quarter do not look particularly good - GDP growth is very likely to slow markedly - and the likelihood of increased tariffs on Eurozone exports by the new Trump administration can only harm the outlook for next year. Inflation permitting, there is nothing in the data to prevent the ECB easing again in December although, for now, a 25 basis point cut seems more probable than a larger 50 basis point move.
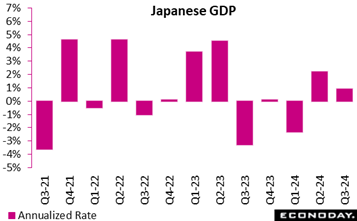 Japan's gross domestic product for the July-September quarter slowed to an as-expected 0.2% on quarter, or an annualized 0.6%, on pullbacks in business investment and public works spending after their rebounds in the previous three-month period. The slowdown also came from an unexpected decline in external demand amid global economic and political uncertainties. Japan's gross domestic product for the July-September quarter slowed to an as-expected 0.2% on quarter, or an annualized 0.6%, on pullbacks in business investment and public works spending after their rebounds in the previous three-month period. The slowdown also came from an unexpected decline in external demand amid global economic and political uncertainties.
Overall, the initial reading for Q3 GDP growth was largely as expected, partly because Q2 growth was revised down to +0.5% q/q from +0.7% and to +2.2% annualized from +2.9%, and also due to surprisingly solid consumer spending amid high costs for necessities that were aggravated by a rare domestic rice supply shortage.
The Q2 rebound was still led by private consumption, which accounts for about 55% of the GDP, and solid corporate capital investment. In the January-March quarter, the economy slumped 0.6% (annualized 2.4%) for the first contraction in two quarters, hit by suspended output at Toyota group factories over a safety test scandal that had a widespread impact beyond the auto industry.
Domestic demand added a strong 0.6 percentage point to total domestic output in Q3 (well above the consensus call of +0.1 point) after boosting the Q2 GDP by 0.7 point. External demand (exports minus imports) pushed down the overall GDP figure by 0.4 point, instead of the median forecast of +0.1 point, marking the third straight quarter of providing a negative contribution.
Looking ahead, the economy in October-December is expected to show only modest growth as many households are struggling to make ends meet amid high costs for food and fuels even though large firms are raising wages to cope with widespread labor shortages. Firms may increase investment in capacity in Q4 compared to Q3.
From a year earlier, the economy posted its first increase in three quarters, up 0.3% as projected by economists, after falling 1.0% previously.
Key components in percentage change on quarter except for private inventories and net exports, whose contributions are in percentage points. Figures in the previous quarter are in parentheses:
Domestic demand +0.6 point, 2nd straight rise (+0.8 point)
Private consumption +0.9%, 2nd straight rise after 4 drops (+0.7%)
Business investment -0.2%, 3rd drop in 5 quarters (+0.9%)
Public investment plus -0.9%, 4th drop in 5 quarters (+4.1%)
Private inventories +0.1 point, 2nd rise in 5 quarters (-0.1 point)
Net exports (external demand) -0.4 point, 4th drop in 5 quarters (-0.1 point)
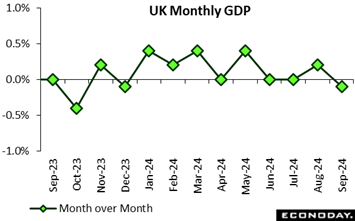 Real GDP over the month fell by 0.1 percent in September, behind forecasts and following a 0.2 percent growth in August. Manufacturing and information and communication services contributed significantly to the September decline, while services output showed no growth, after a 0.1 percent rise in August. Production output dropped by 0.5 percent in September, mainly due to a contraction in manufacturing, reversing the 0.5 percent growth seen in August. Construction output recorded a modest 0.1 percent increase in September, following a revised 0.6 percent rise in August. Real GDP over the month fell by 0.1 percent in September, behind forecasts and following a 0.2 percent growth in August. Manufacturing and information and communication services contributed significantly to the September decline, while services output showed no growth, after a 0.1 percent rise in August. Production output dropped by 0.5 percent in September, mainly due to a contraction in manufacturing, reversing the 0.5 percent growth seen in August. Construction output recorded a modest 0.1 percent increase in September, following a revised 0.6 percent rise in August.
Over the three months to September, real GDP grew by 0.1 percent compared with the previous quarter, driven by retail trade (excluding motor vehicles) and new construction work. Also, services output increased by 0.1 percent over the three months. However, production output declined by 0.2 percent over the three months to September, while construction output expanded by 0.8 percent, marking a continued positive trend.
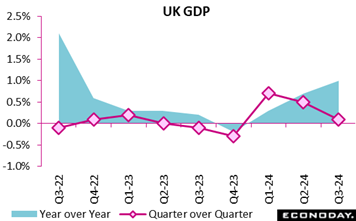 The UK's real GDP increased by 0.1 percent in the third quarter (July to September), slightly below the forecast for the quarter and following a 0.5 percent rise in quarter 2. Year-over-year, real GDP grew by 1.0 percent in line with forecast expectations. The UK's real GDP increased by 0.1 percent in the third quarter (July to September), slightly below the forecast for the quarter and following a 0.5 percent rise in quarter 2. Year-over-year, real GDP grew by 1.0 percent in line with forecast expectations.
In terms of output, the services sector grew by 0.1 percent, construction by 0.8 percent, while the production sector contracted by 0.2 percent. On the expenditure side, net trade, household spending, business investment, and government consumption all contributed positively to GDP growth.
Nominal GDP rose by 0.8 percent, largely driven by higher employee compensation and other income. However, real GDP per head fell by 0.1 percent in the third quarter, remaining unchanged compared with the same quarter a year ago.
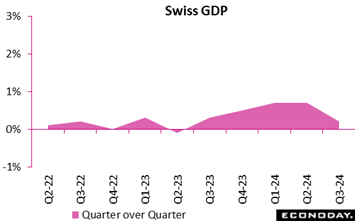 The preliminary estimate shows third quarter real GDP expanding 0.2 percent versus the previous period. Growth in the service sector was partially offset by a contraction in the goods producing sector. The preliminary estimate shows third quarter real GDP expanding 0.2 percent versus the previous period. Growth in the service sector was partially offset by a contraction in the goods producing sector.
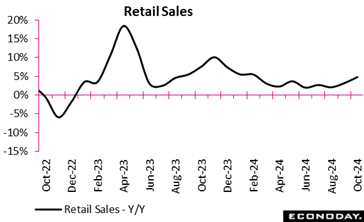 Chinese retail sales rose 4.8 percent on the year in October, picking up sharply from growth of 3.2 percent in September. This is the biggest year-over-year increase since February but still well below growth recorded last year, with property market weakness continuing to weigh on consumer spending. In month-over-month terms, retail sales rose 0.41 percent after advancing 0.39 percent previously. Chinese retail sales rose 4.8 percent on the year in October, picking up sharply from growth of 3.2 percent in September. This is the biggest year-over-year increase since February but still well below growth recorded last year, with property market weakness continuing to weigh on consumer spending. In month-over-month terms, retail sales rose 0.41 percent after advancing 0.39 percent previously.
Today's data follow a series of policy measures announced by Chinese officials in the last two months in response to ongoing weakness in the property sector and sluggish growth in consumer spending and manufacturing output. Officials lowered the seven-day reverse repo rate, cut banks' reserve requirements, and announced government spending planned for next year would be brought forward.
In their statement accompanying today's data, officials characterised the data as showing the economy is exhibiting "steady progress and recovery" but noted "the external environment is increasingly complicated and severe" and "effective demands are still weak at home". Officials, however, provided little guidance about whether additional changes to policy settings will be considered in the near-term.
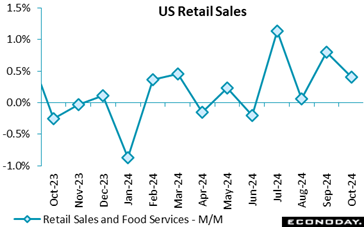 The dollar value of retail and food services sales is up 0.4 percent in October after a sizeable upward revision to up 0.8 percent in September. Total sales in October are slightly higher than the consensus of up 0.3 percent in the Econoday survey of forecasters. Much of the strength in the report is due to an increase of 1.6 percent in motor vehicle sales. Motor vehicle sales likely had a strong month in parts as consumers in the Southeast had to replace vehicles ruined in flooding associated with Hurricanes Helene and Milton. Elsewhere, sales pulled back in some categories after a strong performance in the prior month. The dollar value of retail and food services sales is up 0.4 percent in October after a sizeable upward revision to up 0.8 percent in September. Total sales in October are slightly higher than the consensus of up 0.3 percent in the Econoday survey of forecasters. Much of the strength in the report is due to an increase of 1.6 percent in motor vehicle sales. Motor vehicle sales likely had a strong month in parts as consumers in the Southeast had to replace vehicles ruined in flooding associated with Hurricanes Helene and Milton. Elsewhere, sales pulled back in some categories after a strong performance in the prior month.
Excluding motor vehicles, retail and food sales are up 0.1 percent in October after up 1.0 percent in September. The October rise is below the consensus of up 0.3 percent in the Econoday survey. Sales at gasoline stations are up a scant 0.1 percent in October after falling 0.9 percent. Gasoline prices fell in September and did not rise again in October. Excluding motor vehicles and gasoline, retail and food sales are up 0.1 percent in October after up 1.2 percent in September.
Other categories in October that probably show the impact of the hurricanes are the 2.3 percent rise for electronics and appliances that had to be replaced and up 0.5 percent for building materials for ongoing repairs. Consumers continued to eat out more with sales at restaurants up 0.7 percent in October after up 1.2 percent in September.
Consumers probably filled their immediate needs for back-to-school items in September. Sales at closing stories dip 0.2 percent in October after rising 0.9 percent in September. Sporting goods, hobby, musical instruments, and book store sales fall 1.1 percent in October after up 0.9 percent in September. Nonstore retailers had a 0.3 percent increase in October after a solid up 1.7 percent in September. Nonstore includes online retailers. It is possible that without the Amazon Prime Day sales event that segment would have been weaker as well.
Most categories had upward revisions in September and some back in August. This suggests that the personal consumption component of GDP will be revised higher when the second estimate of third quarter GDP is released at 8:30 ET on Wednesday, November 27.
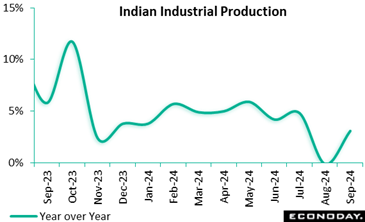 India's index of industrial production rose 3.1 percent on the year in September, rebounding sharply from a fall of 0.1 percent in August. Within the industrial sector, manufacturing output advanced 3.9 percent on the year after an increase of 1.0 percent previously. More up-to-date PMI survey data published previously indicated that month-over-month growth in the manufacturing sector slowed in September before picking up in October. Mining and electricity output rose 0.2 percent and 0.5 percent on the year respectively in September. India's index of industrial production rose 3.1 percent on the year in September, rebounding sharply from a fall of 0.1 percent in August. Within the industrial sector, manufacturing output advanced 3.9 percent on the year after an increase of 1.0 percent previously. More up-to-date PMI survey data published previously indicated that month-over-month growth in the manufacturing sector slowed in September before picking up in October. Mining and electricity output rose 0.2 percent and 0.5 percent on the year respectively in September.
The Reserve Bank of India again left policy rates on hold at 6.50 percent at their most recent meeting held last month, with officials expressing confidence in the resilience of economic activity. Officials also advised that they are shifting their policy stance from "the withdrawal of accommodation" to "neutral". This, they judge, will provide them with greater flexibility in upcoming meetings while enabling them to continue monitoring the path of disinflation.
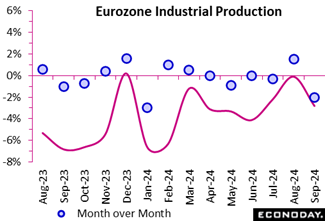 Having expanded a solid, albeit weaker revised, monthly 1.5 percent in August, industrial production slumped fully 2.0 percent in September. This was its steepest decline since January and leaves intact a solid downtrend in output. Yearly growth dropped to minus 2.8 percent and production now stands at its lowest level since September 2020. Having expanded a solid, albeit weaker revised, monthly 1.5 percent in August, industrial production slumped fully 2.0 percent in September. This was its steepest decline since January and leaves intact a solid downtrend in output. Yearly growth dropped to minus 2.8 percent and production now stands at its lowest level since September 2020.
September's nosedive was led by capital goods which fully unwound August's 3.8 percent monthly jump. Elsewhere, consumer durables (0.5 percent) and non-durables (1.6 percent) at least made fresh ground but intermediates were only flat and energy (minus 1.5 percent) declined.
Regionally the headline fall was dominated by Germany where production was down some 2.7 percent. France (minus 0.9 percent) similarly had a poor month as did Italy (minus 0.4 percent) but Spain (0.9 percent) posted a solid gain after back-to-back losses in July/August.
September's surprisingly weak report leaves third quarter Eurozone industrial production 0.3 percent below its second quarter level, implying another hit on GDP growth. Business surveys so far suggest little better in the current period.
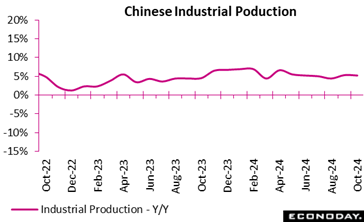 Chinese industrial production rose 5.3 percent on the year in October, easing from growth of 5.4 percent in September. Within the industrial sector, manufacturing output rose 5.4 percent on the year after increasing 6.0 percent previously. Utilities output and mining output rose 5.4 percent and 4.6 percent on the year respectively after previous increases of 6.3 percent and 2.9 percent respectively. In month-over-month terms, industrial production rose 0.41 percent after increasing 0.59 percent previously. Chinese industrial production rose 5.3 percent on the year in October, easing from growth of 5.4 percent in September. Within the industrial sector, manufacturing output rose 5.4 percent on the year after increasing 6.0 percent previously. Utilities output and mining output rose 5.4 percent and 4.6 percent on the year respectively after previous increases of 6.3 percent and 2.9 percent respectively. In month-over-month terms, industrial production rose 0.41 percent after increasing 0.59 percent previously.
Today's data follow a series of policy measures announced by Chinese officials in the last two months in response to ongoing weakness in the property sector and sluggish growth in consumer spending and manufacturing output. Officials lowered the seven-day reverse repo rate, cut banks' reserve requirements, and announced government spending planned for next year would be brought forward.
In their statement accompanying today's data, officials characterised the data as showing the economy is exhibiting "steady progress and recovery" but noted "the external environment is increasingly complicated and severe" and "effective demands are still weak at home". Officials, however, provided little guidance about whether additional changes to policy settings will be considered in the near-term.
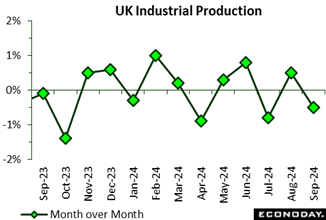 Production output in the UK fell by 0.5 percent in September, following a 0.5 percent rise in August. This marks the lowest monthly output decline since May 2020. This decline was well below the forecasts and was driven primarily by a 1.0 percent drop in manufacturing, alongside decreases in electricity and gas by 1.9 percent and water supply and sewerage by 0.7 percent. These were partly offset by a 3.7 percent increase in mining and quarrying, spurred by a 4.3 percent rise in crude petroleum and natural gas extraction, recovering from a 5.7 percent drop in August. Production output in the UK fell by 0.5 percent in September, following a 0.5 percent rise in August. This marks the lowest monthly output decline since May 2020. This decline was well below the forecasts and was driven primarily by a 1.0 percent drop in manufacturing, alongside decreases in electricity and gas by 1.9 percent and water supply and sewerage by 0.7 percent. These were partly offset by a 3.7 percent increase in mining and quarrying, spurred by a 4.3 percent rise in crude petroleum and natural gas extraction, recovering from a 5.7 percent drop in August.
Manufacturing output fell in 8 of 13 subsectors, with basic metals and metal products contributing the most, down 2.7 percent.
The broader three-month period to September showed that output decreased by 0.2 percent, following a 0.3 percent decline in the second quarter. Electricity and gas output fell by 2.7 percent, and water supply and sewerage declined by 0.9 percent. However, manufacturing grew by 0.2 percent, reflecting a recovery from weakness earlier in the year.
Overall, the data indicates continued volatility in industrial production, with notable sectoral disparities.
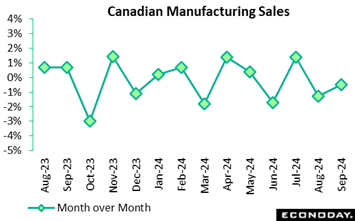 Manufacturing sales retreated by 0.5 percent in September from August, slightly better than expectations for a 0.8 percent decline. Real sales also declined 0.4 percent on the month as the industrial product price index fell 0.6 percent. In year-over-year terms, nominal sales were down a large 5.6 percent and declined by 5.1 percent in real terms. Manufacturing sales retreated by 0.5 percent in September from August, slightly better than expectations for a 0.8 percent decline. Real sales also declined 0.4 percent on the month as the industrial product price index fell 0.6 percent. In year-over-year terms, nominal sales were down a large 5.6 percent and declined by 5.1 percent in real terms.
Looking ahead, indicators are promising as new orders jumped 3.9 percent on the month and unfilled orders rose 1.6 percent.
Inventories fell 0.4 percent, and the inventory-to-sales ratio was flat at 1.74 in September from 1.74 in August and versus 1.68 a year ago.
On the unfortunate side, the unadjusted capacity utilization rate dropped to 78.6 in September from 79.5 percent in August and versus 78.6 percent in September a year ago.
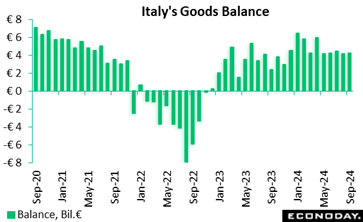 The seasonally adjusted trade balance was in a €4.25 billion surplus in September, up from August's larger revised €4.13 billion. The seasonally adjusted trade balance was in a €4.25 billion surplus in September, up from August's larger revised €4.13 billion.
Exports to the Eurozone declined 3.0 percent versus August and fell 1.4 percent to non-EU countries. Conversely, imports increased 1.2 percent, primarily due to a 1.1 percent rise in EU imports.
Year-over-year, total exports were down 2.2 percent while imports fell by 3.2 percent. Exports to EU countries decreased by 3.0 percent, while those to non-EU markets dropped 1.4 percent. Imports from the EU decreased 3.2 percent, imports from non-EU countries fell a steep 8.8 percent.
Month-over-month, import prices decreased by 0.7 percent, and increased by 0.5 percent year-over-year.
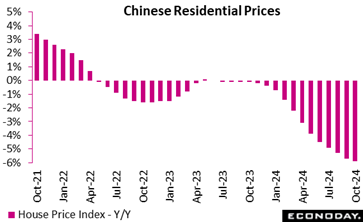 China's residential property prices fell 5.9 percent on the year in October, weakening further from a decline of 5.7 percent in September. This is the biggest year-over-year decline in house prices since 2015. China's property market has been very weak for two years, representing a major drag on investment and consumer spending. China's residential property prices fell 5.9 percent on the year in October, weakening further from a decline of 5.7 percent in September. This is the biggest year-over-year decline in house prices since 2015. China's property market has been very weak for two years, representing a major drag on investment and consumer spending.
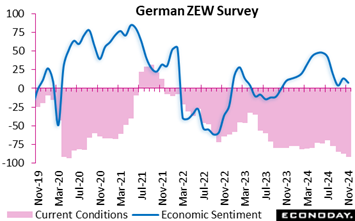 The November ZEW survey reveals a notably more cautious assessment of the Germany's economy. The Economic Sentiment Indicator fell from 13.1 to 7.4 while the current situation indicator dropped from minus 86.9 to minus 91.4, its fourth straight decline and its weakest level May 2020. The November ZEW survey reveals a notably more cautious assessment of the Germany's economy. The Economic Sentiment Indicator fell from 13.1 to 7.4 while the current situation indicator dropped from minus 86.9 to minus 91.4, its fourth straight decline and its weakest level May 2020.
The results show analysts less confident about the outlook and clearly more concerned about the current state of German economic activity. Similarly, the Eurozone's economic sentiment fell from 20.1 to 12.5 pointing to less optimism about prospect for the region in general.
The results suggest that any recovery in German economic activity is still some way off and will only underpin worries about the potential hit to growth should President-elect Trump deliver on his promise to hike tariffs.
The global economy is slightly hotter than expected.
Econoday’s Relative Economic Performance Index (RPI) lost some ground last week but, at 8, still shows global economic activity running a little ahead of market forecasts. The U.S., Eurozone and Japan are all modestly outperforming expectations while the UK, Canada and Switzerland struggle to keep up.
In the U.S., October inflation offered no surprises but the RPI (19) and RPI-P (20) both edged a little higher. Economic activity in general continues to outpace expectations, prompting forecasters to adopt a more cautious view of future Federal Reserve easing.
In Canada, September manufacturing sales fell by less than anticipated. However, at minus 17, both the RPI and RPI-P remain in negative surprise territory and leave economic fundamentals still pointing to another cut in Bank of Canada interest rates in December.
In the Eurozone, the RPI (13) and RPI-P (1) held above zero but, courtesy of fresh weakness in manufacturing activity, only just. That said, while the real economy is essentially matching expectations, recent inflation data have surprised on the upside, making a 25 basis point cut by the European Central Bank next month more likely than a 50 basis point move.
In the UK, third quarter output was surprisingly soft, leaving both the RPI (minus 20) and RPI-P (minus 24) sub-zero for a third straight week. This keeps alive the possibility of another reduction in Bank Rate in December but Wednesday’s October CPI update will be more important.
In Switzerland, the Swiss National Bank pointed out that further monetary easing is not a done deal. However, with the RPI sliding to minus 35, the RPI-P to minus 25 and the latest inflation data again unexpectedly soft, another cut in the policy rate in December will be hard to avoid.
In Japan, third quarter growth matched expectations but October pipeline inflation was unexpectedly firm and the RPI (16) and RPI-P (12) both ended the period showing overall economic activity slightly stronger than expected. With forecasters still uncertain about the timing of the next central bank tightening, Bank of Japan Governor Kazuo Ueda’s address on Monday will be a key market focus this week.
In China, following a month of data surpassing expectations, the RPI eased to exactly zero, meaning that forecasters have caught up with recent signs of tentative economic recovery. As part of a broader easing package, the People’s Bank of China cut its prime loan rates aggressively earlier this month and investors will be looking closely for additional signs that economic activity in general, and prices in particular, are now on the way up.
**Contributing to this article were Jeremy Hawkins, Brian Jackson, Mace News, Max Sato, Olajide Oyadeyi, and Theresa Sheehan
Monday starts off with Canadian housing starts, which are expected to rise to an annual rate of 240,000 in October after bouncing back to 224,000 in September from a recent low of 213,000 in August. Housing starts have been trending down, reflecting overall weakness in Canada despite relaxed financing conditions delivered by the Bank of Canada.
On Tuesday, Canada’s annual inflation reading is expected to correct higher to 1.9 percent in October from 1.6 percent in September and 2.0 percent in August. The September figure was the lowest since February 2021. On a monthly unadjusted basis, forecasters expect a 0.3 percent rebound after the 0.4 percent drop in September and 0.2 percent decline in August. Inflation readings like this are expected to keep rate cuts coming from the Bank of Canada.
US housing starts are estimated to be a little soft at a 1.3 million unit rate in October versus 1.4 million in September. Permits are expected flat at 1.4 million versus 1.4 million in September.
Wednesday, Japan’s merchandise trade is balance is expected to post a deficit of ¥132.2 billion for a fourth consecutive shortfall, after a revised ¥294.1 billion deficit in September and compared with a ¥702.86 billion deficit in October 2023 and a record shortfall of ¥3,506.43 billion (¥3.51 trillion) in January 2023. Japanese export values are forecast to show a rebound in October, up 3.0%, after falling 1.7% in September for their first year-on-year drop in 10 months. An increase in semiconductor-producing equipment appears to be partly offset by drops in automobiles, mineral fuels and iron/steel. Import values are expected to mark their first decline in seven months, down 1.8%, on crude oil, semiconductors and smartphones, following a 2.1% rise the previous month.
China’s monetary authorities cut the loan prime rate by 25 bp in last month’s fixing to boost the economy. Forecasters uniformly expect no change this month in 1-year or 5-year rates.
UK’s consumer price index is estimated to fall more than expected to a 1.7 percent rate in September from 2.2 percent in August. Forecasters expect the rate to rebound to 2.2 percent on year in October with a 0.5 percent jump on the month. A big rise in household energy bills is expected to push headline inflation higher in October. Core inflation is expected to be better behaved.
On Thursday, US jobless claims are expected to edge up to 219,000, closer to the four-week moving average at 227,250 after a lower than expected 217,000 in the prior week.
Friday, Japan’s consumer price index is expected to ease further to 2.2% in the core reading in October from 2.4% in September and 2.8% in August. The year-on-year increase in the total CPI is forecast at 2.3%, also down from 2.5% in September. By contrast, underlying inflation measured by the core-core CPI (excluding fresh food and energy) is seen at 2.3%, up from 2.1% the previous month, as this relatively younger series is unaffected by energy prices. The Bank of Japan, which expects inflation to be anchored around its 2% target by early 2026, is on course for at least three more 25 basis point rate hikes that would take the overnight interest rate target to 1% by late 2025 as part of its gradual normalization process after more than a decade of large-scale easing.
Canada Housing Starts for October (Mon 0815 EST; Mon 1315 GMT)
Consensus Forecast, Annual Rate: 240,000
Consensus Range, Annual Rate: 224,000 to 256,000
Starts are expected up again at an annual rate of 240,000 in October after bouncing back to 224,000 in September from a recent low of 213,000 in August. Housing starts have been trending down, reflecting overall weakness in Canada despite relaxed financing conditions delivered by the Bank of Canada.
US Housing Market Index for November (Mon 1000 EST; Mon 1500 GMT)
Consensus Forecast, Index: 43
Consensus Range, Index: 40 to 45
The HMI is expected at 43 again in November after ticking up to 43 in October from 41 in September.
Eurozone HICP for October (Tue 1100 CEST; Tue 1000 GMT; Tue 0500 EST)
Consensus Forecast, HICP - Y/Y: 2.0%
Consensus Range, HICP - Y/Y: 2.0% to 2.0%
Consensus Forecast, Narrow Core - Y/Y: 2.7%
Consensus Range, Narrow Core - Y/Y: 2.7% to 2.7%
No revision from the flash report is the call with October Eurozone HICP at 2.0 percent on year for the total and 2.7 percent for narrow core.
Canada CPI for October (Tue 0830 EST; Tue 1330 GMT)
Consensus Forecast, CPI - M/M: 0.3%
Consensus Range, CPI - M/M: -0.1% to 0.4%
Consensus Forecast, CPI - Y/Y: 1.9%
Consensus Range, CPI - Y/Y: 1.8% to 2.0%
Canada’s annual inflation reading is expected to correct higher to 1.9 percent in October from 1.6 percent in September and 2.0 percent in August. The September figure was the lowest since February 2021. On a monthly unadjusted basis, forecasters expect a 0.3 percent rebound after the 0.4 percent drop in September and 0.2 percent decline in August. Inflation readings like this are expected to keep rate cuts coming from the Bank of Canada.
US Housing Starts and Permits for October (Tue 0830 EST; Tue 1330 GMT)
Consensus Forecast, Starts - Annual Rate: 1.3M
Consensus Range, Starts - Annual Rate: 1.3M to 1.4M
Consensus Forecast, Permits - Annual Rate: 1.4M
Consensus Range, Permits - Annual Rate: 1.4M to 1.5M
Forecasters see housing starts a little soft at a 1.3 million unit rate in October versus 1.4 million in September. Permits are expected flat at 1.4 million versus 1.4 million in September.
China Loan Prime Rate for November (Wed 0915 CST; Wed 0115 GMT; Wed 2015 EST)
Consensus Forecast, 1-Year Rate - Change: 0 bp
Consensus Range, 1-Year Rate - Change: 0 bp to 0 bp
Consensus Forecast, 1-Year Rate - Level: 3.10%
Consensus Range, 1-Year Rate - Level: 3.10% to 3.10%
Consensus Forecast, 5-Year Rate - Change: 0 bp
Consensus Range, 5-Year Rate - Change: 0 bp to 0 bp
Consensus Forecast, 5-Year Rate - Level: 3.60%
Consensus Range, 5-Year Rate - Level: 3.60% to 3.60%
Chinese monetary authorities cut the loan prime rate by 25 bp in last month’s fixing to boost the economy. Forecasters uniformly expect no change this month in 1-year or 5-year rates.
UK CPI for October (Wed 0700 GMT; Wed 0200 EST)
Consensus Forecast, M/M: 0.5%
Consensus Range, M/M: 0.4% to 0.5%
Consensus Forecast, Y/Y: 2.2%
Consensus Range, Y/Y: 2.1% to 2.2%
CPI fell more than expected to a 1.7 percent rate in September from 2.2 percent in August. Forecasters expect the rate to rebound to 2.2 percent on year in October with a 0.5 percent jump on the month. A big rise in household energy bills is expected to push headline inflation higher in October. Core inflation is expected to be better behaved.
Germany PPI for October (Wed 0800 CET; Wed 0700 GMT; Wed 0200 EST)
Consensus Forecast, M/M: -0.1%
Consensus Range, M/M: -0.2% to 0.3%
Consensus Forecast, Y/Y: -1.1%
Consensus Range, Y/Y: -1.4% to -0.9%
Forecasts center on a modest 0.1 percent decline on the month and a 1.1 percent decline on year.
US Jobless Claims for Week of Nov 16 (Thu 0830 EST; Thu 1330 GMT)
Consensus Forecast, Initial Claims - Level: 219K
Consensus Range, Initial Claims - Level: 215K to 225K
After a lower than expected 217,000 in the prior week, forecasters expect claims to edge up to 219,000, closer to the four-week moving average at 227,250.
US Philadelphia Fed Manufacturing Index for November (Thu 0830 EST; Thu 1330 GMT)
Consensus Forecast, Index: 7.0
Consensus Range, Index: 0.0 to 11.0
After a big jump in current conditions to 10.3 in October from 1.7 in September, forecasters expect a slight retreat to a still expansionary 7.0 in November.
US Existing Home Sales for October (Thu 1000 EST; Thu 1500 GMT)
Consensus Forecast, Annual Rate: 3.9M
Consensus Range, Annual Rate: 3.9M to 4.1M
Home sales are expected pretty steady at a 3.9 million unit annual rate in October after declining marginally to 3.84 million in September from 3.88 in August.
Eurozone EC Consumer Confidence Flash for November (Thu 1600 CET; Thu 1500 GMT; Thu 1000 EST)
Consensus Forecast, Index: -12.1
Consensus Range, Index: -13.1 to -11.0
Confidence has been edging up slowly and another improvement to minus 12.1 in October from minus 12.5 in September is expected.
US Leading Indicators for October (Thu 1000 EST; Thu 1500 GMT)
Consensus Forecast, M/M: -0.3%
Consensus Range, M/M: -0.4% to -0.1%
Another decline is the call for leading indicators, down 0.3 percent after a decline of 0.5 percent in September.
UK Retail Sales for October (Fri 0700 GMT; Fri 0200 EST)
Consensus Forecast, M/M: -0.3%
Consensus Range, M/M: -0.4% to -0.2%
Consensus Forecast, Y/Y: 3.2%
Consensus Range, Y/Y: 3.0% to 3.5%
Forecasters look for retail sales down 0.3 percent on the month and up 3.2 percent on year. That would show significant slowing after September’s 0.3 percent increase on the month and 3.9 percent rise on the year.
Germany GDP for Third Quarter (Fri 0800 CET; Fri 0700 GMT; Fri 0200 EST)
Consensus Forecast, Q/Q: 0.2%
Consensus Range, Q/Q: 0.2% to 0.2%
Consensus Forecast, Y/Y: -0.2%
Consensus Range, Y/Y: -0.2% to 0.2%
No revision is the call for German GDP at 0.2 percent on the quarter and minus 0.2 percent on year.
France PMI Index Flash for November (Fri 0915 CET; Fri 0815 GMT; Fri 0315 EST)
Consensus Forecast, Manufacturing Index: 44.6
Consensus Range, Manufacturing Index: 44.5 to 44.7
PMI Services Index Flash for November (Fri 0915 CET; Fri 0815 GMT; Fri 0315 EST)
Consensus Forecast, Services Index: 49.0
Consensus Range, Services Index: 48.9 to 49.2
Expectations call for a very contractionary 44.6 for the manufacturing flash and 49.0 for services.
Germany PMI Composite Flash for November (Fri 0930 CET; Fri 0830 GMT; Fri 0330 EST)
Consensus Forecast, Composite Index: 48.6
Consensus Range, Composite Index: 47.0 to 49.2
Consensus Forecast, Manufacturing Index: 43.0
Consensus Range, Manufacturing Index: 41.0 to 44.9
Consensus Forecast, Services Index: 51.6
Consensus Range, Services Index: 50.9 to 52.0
The consensus looks for the composite flash at 48.6, manufacturing flash at a very weak 43.0, and services flash still showing expansion at 51.6.
Eurozone PMI Composite Flash for November (Fri 1000 CET; Fri 0900 GMT; Fri 0400 EST)
Consensus Forecast, Composite Index: 50.2
Consensus Range, Composite Index: 49.5 to 50.3
Consensus Forecast, Manufacturing Index: 46.0
Consensus Range, Manufacturing Index: 46.0 to 46.5
Consensus Forecast, Services Index: 51.7
Consensus Range, Services Index: 51.0 to 52.0
Forecasters look for the composite flash at 50.2, the manufacturing flash at 46.0 and 51.7 for services.
UK PMI Composite Flash for November (Fri 0930 GMT; Fri 0430 EST)
Consensus Forecast, Composite Index: 51.8
Consensus Range, Composite Index: 51.6 to 52.0
Consensus Forecast, Manufacturing Index: 50.0
Consensus Range, Manufacturing Index: 49.0 to 50.1
Consensus Forecast, Services Index: 52.1
Consensus Range, Services Index: 52.0 to 52.3
The consensus looks for the composite flash at 51.8, manufacturing flash at a neutral 50.0, and services flash still showing expansion at 52.1.
Canada Retail Sales for September (Fri 0830 EST; Fri 1330 GMT)
Consensus Forecast, M/M: 0.4%
Consensus Range, M/M: 0.3% to 0.4%
Forecasters agree with Stats Canada’s advance retail indicator that looked for retail sales up 0.4 percent in September.
US PMI Flash for November (Fri 0945 EST; Fri 1445 GMT)
Consensus Forecast, Manufacturing Index: 48.8
Consensus Range, Manufacturing Index: 48.0 to 49.2
Consensus Forecast, Services Index: 55.1
Consensus Range, Services Index: 55.0 to 55.4
The consensus looks for PMI manufacturing flash at 48.8 and services at 55.1.
US Consumer Sentiment for November (Fri 1000 EST; Fri 1500 GMT)
Consensus Forecast, Index: 73.0
Consensus Range, Index: 72.0 to 73.5
Consensus Forecast, Year-ahead Inflation Expectations: 2.6%
Consensus Range, Year-ahead Inflation Expectations: 2.6% to 2.6%
Sentiment came in stronger than expected in the November flash with the survey sample taken before the presidential election result. Oddly, forecasts call for no change in the final November report with the survey following November 5. Estimates center on a 73.0 reading for sentiment, unchanged from the flash, and up from 70.5 in October and 61.3 in November 2023. Inflation expectations are expected at 2.6 percent versus 2.6 percent in the November flash and 2.7 percent in October final.
|

