|
The monthly employment report came in more-or-less as expected for November, with a solid increase of 227,000 and a net upward revision of 56,000 in the prior two months. The data showed a rebound from the special factors that weakened the report in October – two major hurricanes in late September and early October, and strike activity for 38,000 workers in employment and 1,900 in leisure and hospitality. The unemployment rate is up a tenth to 4.2 percent in November as the labor force declined in size. This also brought the participation rate down a tenth to 62.5 percent in November. Taking the rebound into account, overall payroll growth remains on a steady path of increases while unemployment is consistent with a healthy labor market.
There was a modest upside surprise in the preliminary University of Michigan consumer sentiment index for December at 74.0 after 71.8 in November. The report noted that consumers continue to “re-calibrate” their views on the economy after the presidential election. The December increase was entirely due to a jump in the current conditions index to 77.7 from 63.9 in November. In turn, this was due to consumers deciding that now is a better time to buy than later when tariffs could hike the prices of hard goods. On the flip side, expectations for six months from now are down to 71.6 in December after 76.9 in November with a new set of uncertainties to navigate about the US economy and geopolitical events.
 The Reserve Bank of India's Monetary Policy Committee has left the benchmark repurchase rate unchanged at 6.50 percent at its policy review held today, in line with the consensus forecast. This rate has now been on hold since February 2023 after it was earlier increased by a cumulative 250 basis points beginning in mid-2022. The Reserve Bank of India's Monetary Policy Committee has left the benchmark repurchase rate unchanged at 6.50 percent at its policy review held today, in line with the consensus forecast. This rate has now been on hold since February 2023 after it was earlier increased by a cumulative 250 basis points beginning in mid-2022.
The RBI did, however, cut its bank reserve requirement by 50 basis points to 4.0 percent as a means of boosting liquidity in the banking system and to address seasonal demand for reserves. By freeing up reserves, banks are in position to expand lending.
Data released since the RBI's previous meeting in October have shown headline CPI inflation increasing from 3.65 percent in August to 5.49 percent in September and 6.21 percent in October, above the RBI's target range of two percent to six percent. This increase was anticipated by offcials and mainly reflects the impact of higher food prices. The Reserve Bank of India's Monetary Policy Committee has left the benchmark repurchase rate unchanged at 6.50 percent at its policy review held today, in line with the consensus forecast. This rate has now been on hold since February 2023 after it was earlier increased by a cumulative 250 basis points beginning in mid-2022.
Data released since the RBI's previous meeting in September have shown headline CPI inflation falling from 5.08 percent in September to 3.54 percent in August and 3.65 percent in September, below the mid-point of the RBI's target range of two percent to six percent. Recent activity data, meanwhile, have shown weaker growth in consumption and investment.
In the statement accompanying today's decision, RBI officials noted that the recent spike in inflation highlighted risks to the outlook and reaffirmed their commitment to "restoring the balance between inflation and growth in the overall interest of the economy". With officials expressing confidence about the outlook for growth, it is clear that inflation remains their main focus.
The statement also notes that officials' policy stance remains "neutral" for now. This, they judge, will provide them with greater flexibility in upcoming meetings while enabling them to continue monitoring the path of disinflation. They also repeated their earlier pledge to remain focused on achieving "a durable alignment of the headline CPI inflation with the target".
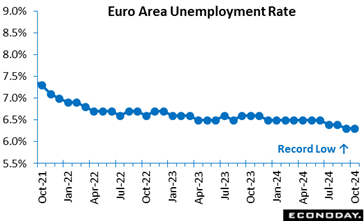 Eurozone unemployment fell just 3,000 to 10.841 million in October. Year-over-year, the decrease was a more pronounced 411,000 and with the unemployment rate unchanged at September's 6.3 percent, a record low, this latest update suggests that the labour market is tight, albeit stabilsing. The outcome was in line with the market consensus Eurozone unemployment fell just 3,000 to 10.841 million in October. Year-over-year, the decrease was a more pronounced 411,000 and with the unemployment rate unchanged at September's 6.3 percent, a record low, this latest update suggests that the labour market is tight, albeit stabilsing. The outcome was in line with the market consensus
Amongst the larger Eurozone countries, the national unemployment rate rose in France (7.6 percent after 7.5 percent), while it decreased in Italy (5.8 percent after 6.0 percent), but was stable in both Germany (3.4 percent) and Spain (11.2 percent).
October's labour market developments leave joblessness historically low and will probably ensure that at least some members on the ECB's General Council remain cautious about the pace of interest rate cuts going forward. A 25 basis point cut remains probable in December and a larger ease less so. The focus on wages will be sharp.
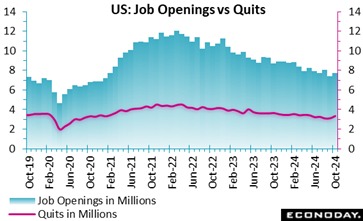 The number of job openings rose to 7.744 million (a rate of 4.6 percent) in October, from a downwardly revised 7.372 million (4.4 percent) in September and compared to the expectation of 7.49 million in the Econoday survey of forecasters. Job openings fell by 941,000 compared to a year ago. The number of job openings rose to 7.744 million (a rate of 4.6 percent) in October, from a downwardly revised 7.372 million (4.4 percent) in September and compared to the expectation of 7.49 million in the Econoday survey of forecasters. Job openings fell by 941,000 compared to a year ago.
October hires were 5.313 million (3.3 percent), after 5.552 million (3.5 percent) in September, and were down by 501,000 compared to October 2023.
The data confirms the softer labor market trends so far for the second half of 2024, but without any cause for Federal Reserve officials to be alarmed.
The number of total separations was 5.261 million (3.3 percent) in October, vs 5.196 million (3.3 percent) in September. Within separations, quits were at 3.326 million (2.1 percent) after 3.098 million (1.9 percent) in September, while layoffs and discharges came in at 1.633 million (1 percent) following 1.802 million (1.1 percent) in September.
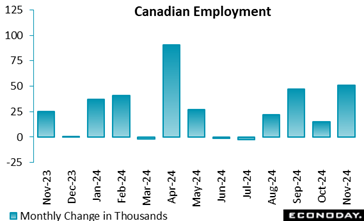 Canada's employment growth rebounded, somewhat, in November, but remains weak - rising by 51,000 or a tepid 0.2 percent from October, above expectations in Econoday's survey of forecasters for a 30,000 gain. The unemployment rate rose to 6.8 percent in November from 6.5 percent in October, as the labor force grew. Forecasters looked for unemployment to rise to 6.6 percent in November. Canada's employment growth rebounded, somewhat, in November, but remains weak - rising by 51,000 or a tepid 0.2 percent from October, above expectations in Econoday's survey of forecasters for a 30,000 gain. The unemployment rate rose to 6.8 percent in November from 6.5 percent in October, as the labor force grew. Forecasters looked for unemployment to rise to 6.6 percent in November.
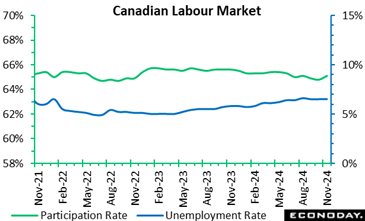
The November unemployment rate hit its highest level since January 2017 (not counting the COVID-impacted impacted 2020-2021 period) and has been on an upward trend since April 2023 – up 1.7 percentage points. This data supports another rate cut by the Bank of Canada when it meets on December 11 and might even push the central bank to deliver another aggressive 50 basis point reduction.
The participation rate rose to 65.1 percent in November from 64.8 percent in October and versus 64.9 percent in September. The participation rate is down 0.5 percentage points compared to a year ago.
Total hours worked fell 0.2 percent in November but are up 1.9 percent from a year ago. Average hourly wages increased at a slower pace, rising by 4.1 percent year-over-year after the annual growth rate was 4.9 percent in October, and +4.6 percent in September.
November was the fifth straight month of relatively weak employment growth. For November, employment gains were mainly in full-time work, up 54,000 or 0.3 percent.
Private sector jobs rose by a mere 6,300 in November after a 20,500 increase in October. Public sector employment increased by 45,000 after falling by 17,200 in October and self-employment shrank by 700 in November.
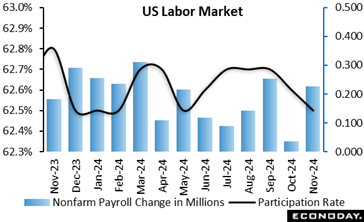 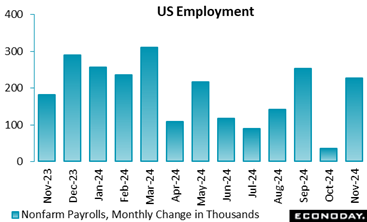 Nonfarm payrolls are up 227,000 in November after upward revisions to 36,000 in October and 255,000 in September. The net upward revision to the prior two months is 56,000. The November nonfarm payrolls increase is somewhat above the consensus of up 211,000 in the Econoday survey of forecasters. As expected, payrolls recovered from the impacts of severe weather and strike activity in the prior month. For the fourth quarter to date, the average monthly increase in nonfarm payrolls is 132,000 compared to 159,000 in the third quarter,147,000 in the second quarter, and 267,000 in the first quarter 2024. The pace of payroll growth has cooled but remains at a level this is historically able to absorb new workers coming into the labor market and those who have been laid off. Nonfarm payrolls are up 227,000 in November after upward revisions to 36,000 in October and 255,000 in September. The net upward revision to the prior two months is 56,000. The November nonfarm payrolls increase is somewhat above the consensus of up 211,000 in the Econoday survey of forecasters. As expected, payrolls recovered from the impacts of severe weather and strike activity in the prior month. For the fourth quarter to date, the average monthly increase in nonfarm payrolls is 132,000 compared to 159,000 in the third quarter,147,000 in the second quarter, and 267,000 in the first quarter 2024. The pace of payroll growth has cooled but remains at a level this is historically able to absorb new workers coming into the labor market and those who have been laid off.
Private payrolls are up 194,000 in November. Goods-producers' payrolls are up 34,000 with modest gains of 22,000 in manufacturing, 10,000 in construction, and 2,000 in mining and loggings. Service-providers' payrolls are up 160,000 on broad-based gains. The largest share of new jobs in the service sector are education and health services at up 79,000 or about 49 percent of the sector, and leisure and hospitality at up 53,000 or about 33 percent of the total for services. Government jobs are up 33,000 with gains of 11,600 in state education and 5,500 in local education.
Average hourly earnings are up 0.4 percent in November from the prior month and up 4.0 percent from November 2023. This is the same increase as seen in October. Moderation in the pace of increases for average hourly earnings appears to have reached a plateau. Businesses are still having to offer wage increases to find the workers they need who have the right skills and/or experience.
The unemployment rate is up a tenth to 4.2 percent in November and the U-6 unemployment rate – the broadest measure of unemployment – is also up a tenth to 7.8 percent. The labor force decreased in November, down 193,000 to 168.286 million with the number of employed down 355,000 and the number of unemployed up 161,000. A smaller labor force led to a one-tenth tick lower for the labor force participation rate to 62.5 percent.
Moderate increases in nonfarm payrolls will assure Fed policymakers that conditions in the labor market are consistent with mild expansion. The minor change in the unemployment rate leaves it in line with recent months and does not suggest a deterioration in conditions. Note that the rounding in the unemployment rate is just below the threshold that would have made it 4.3 percent and taken it back to the 4.3 percent seen in July.
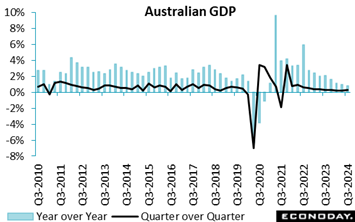 Australia's GDP expanded 0.3 percent on the quarter in the three months to September, up slightly from the 0.2 growth recorded in the three months to June but below the consensus forecast of 0.5 percent. The economy has now grown at a weak pace for two years, reflecting the impact of tight monetary policy settings. GDP rose 0.8 percent on the year in the three months to September, slowing from 1.0 percent in the three months to June and also below the consensus forecast of 1.0 percent. This is the weakest year-over-year growth since the pandemic. Australia's GDP expanded 0.3 percent on the quarter in the three months to September, up slightly from the 0.2 growth recorded in the three months to June but below the consensus forecast of 0.5 percent. The economy has now grown at a weak pace for two years, reflecting the impact of tight monetary policy settings. GDP rose 0.8 percent on the year in the three months to September, slowing from 1.0 percent in the three months to June and also below the consensus forecast of 1.0 percent. This is the weakest year-over-year growth since the pandemic.
Household consumption and private investment were both flat on the quarter after a previous increase of 0.2 percent, while net trade made only a small contribution to headline growth of 0.1 percentage points. Government spending increased 0.3 percent on the quarter.
Today's data cover the period in which officials at the Reserve Bank of Australia continued to leave policy rates on hold. At their latest meeting, held last month, officials left rates on hold again and again advised that they could not rule out further rate increases. Today's data, however, suggests that previous policy tightening is continuing to weigh heavily on demand and activity.
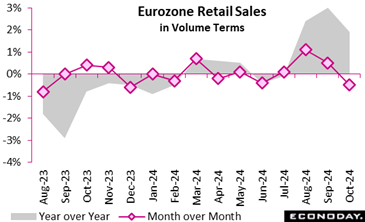 Month-over-month, retail trade volumes contracted by 0.5 percent, missing the mark consensus by a wide margin and fully reversing September's unrevised gain. Non-food products (excluding automotive fuel) saw the sharpest decline, down by 0.9 percent, while automotive fuel sales dipped slightly (minus 0.3 percent). However, sales of food, drinks, and tobacco showed resilience with a marginal increase of 0.1 percent. Month-over-month, retail trade volumes contracted by 0.5 percent, missing the mark consensus by a wide margin and fully reversing September's unrevised gain. Non-food products (excluding automotive fuel) saw the sharpest decline, down by 0.9 percent, while automotive fuel sales dipped slightly (minus 0.3 percent). However, sales of food, drinks, and tobacco showed resilience with a marginal increase of 0.1 percent.
On an annual basis, the retail sector showed stronger performance, with total sales up by 1.9 percent. Non-food products (excluding automotive fuel) led the growth, rising by 2.7 percent, while automotive fuel also posted a robust annual increase of 1.9 percent. Food, drink, and tobacco purchases were up 0.6 percent.
Regionally, France (0.0 percent) and Spain (0.0 percent) remained stable over the month, while Germany lost ground (minus 1.4 percent after 1.5 percent). Elsewhere the picture was similarly mixed.
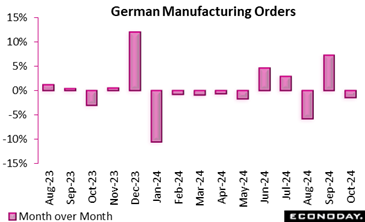 The manufacturing sector exhibited a mixed performance in October. New orders fell by 1.5 percent month-over-month, 0.5 percentage points less than expected and that after a sizeable upward revision to September's advance. The drop was largely driven by declines in machinery (minus 7.6 percent) and automotive (minus 3.7 percent) manufacturing. Annual growth was boosted by positive base effects which led to sizeable gains in basic metals (10.2 percent) and electronics (8.0 percent). The manufacturing sector exhibited a mixed performance in October. New orders fell by 1.5 percent month-over-month, 0.5 percentage points less than expected and that after a sizeable upward revision to September's advance. The drop was largely driven by declines in machinery (minus 7.6 percent) and automotive (minus 3.7 percent) manufacturing. Annual growth was boosted by positive base effects which led to sizeable gains in basic metals (10.2 percent) and electronics (8.0 percent).
However, the regional picture was disappointing with domestic orders falling a sharp 5.3 percent, leaving a cumulative loss of fully 11.4 percent since July. By contrast, foreign orders rose 0.8 percent, compounding a 9.3 percent spurt in September. This reflected a particularly strong contribution from outside the euro area (6.3 percent).
Turnover data painted a subdued picture, declining 1.2 percent month-over-month and 3.9 percent year-over-year, reflecting weaker demand in some capital goods industries (minus 3.6 percent). Meanwhile, intermediate goods (0.9 percent) and consumer goods (4.2 percent) sectors offered bright spots, showcasing diversification in demand patterns. These trends highlight the manufacturing sector's vulnerability to external shocks and dependence on large contracts for overall growth.
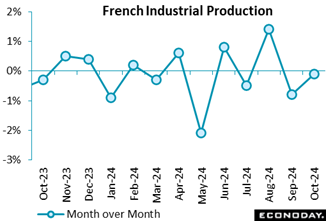 In October, industrial output fell 0.1 percent over the month, some 0.4 percentage points below the consensus estimate. Manufacturing output was flat within which machinery and equipment (1.8 percent) and coke and refined petroleum products (4.8 percent) showed significant rebounds, while transport equipment (minus 2.4 percent) and food products (minus 0.5 percent) experienced declines. In October, industrial output fell 0.1 percent over the month, some 0.4 percentage points below the consensus estimate. Manufacturing output was flat within which machinery and equipment (1.8 percent) and coke and refined petroleum products (4.8 percent) showed significant rebounds, while transport equipment (minus 2.4 percent) and food products (minus 0.5 percent) experienced declines.
Year-over-year, industrial production output fell by 0.6 percent, driven by sharp declines in transport equipment (minus 5.0 percent), machinery and equipment (minus 2.7 percent), and refined petroleum products (minus 5.3 percent). However, modest growth in mining and quarrying (1.8 percent) and food products (0.9 percent) provided some balance. Energy-intensive industries remain heavily impacted by elevated energy costs linked to contracts from 2022 and 2023. Sectors like iron and steel (minus 23.5 percent) and basic chemicals (minus 17.2 percent) continue to face significant reductions compared to pre-energy price surge levels in 2021.
Production in September was revised marginally firmer but the overall picture remains soft and the sector is unlikely to provide much, if any support, for fourth quarter GDP growth.
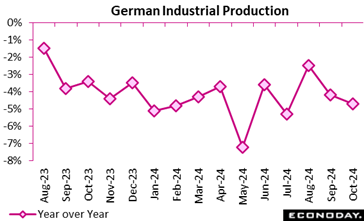 In October, industrial production fell by 1.0 percent compared to the previous month, a stark contrast with the consensus projections of a 1.5 percent rise and following a smaller revised 2.0 percent drop in September. Energy production was a significant driver of the decline, plummeting by 8.9 percent month-over-month. The automotive industry also contributed negatively, with a 1.9 percent fall decline. Year-over-year, output rose by 4.7 percent. In October, industrial production fell by 1.0 percent compared to the previous month, a stark contrast with the consensus projections of a 1.5 percent rise and following a smaller revised 2.0 percent drop in September. Energy production was a significant driver of the decline, plummeting by 8.9 percent month-over-month. The automotive industry also contributed negatively, with a 1.9 percent fall decline. Year-over-year, output rose by 4.7 percent.
Excluding energy and construction, industrial production decreased by 0.3 percent from September, highlighting broad-based weaknesses. Consumer goods production dropped by 1.0 percent, and capital goods 0.4 percent, although intermediate goods showed a slight improvement of 0.4 percent. The construction sector remained stable, offering no relief to the overall contraction.
Energy-intensive industries faced sustained pressure, with output down 0.9 percent month-over-month and 4.0 percent lower in the August–October period compared to the previous three months. Year-over-year, production in energy-intensive branches declined by 0.8 percent, underscoring the impact of high energy costs and subdued demand.
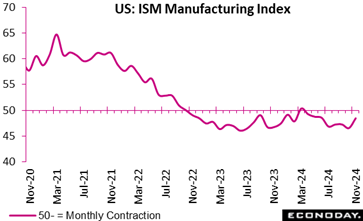 U.S. manufacturing activity was in contraction for an eighth straight month in November as firms remain reluctant to invest amid uncertainties over President-elect Donald Trump's hefty tariff threats on America's close trading partners but the pace of decline eased slightly on optimism that a Republican administration will be business friendly, the latest monthly data from the Institute for Supply Management showed. U.S. manufacturing activity was in contraction for an eighth straight month in November as firms remain reluctant to invest amid uncertainties over President-elect Donald Trump's hefty tariff threats on America's close trading partners but the pace of decline eased slightly on optimism that a Republican administration will be business friendly, the latest monthly data from the Institute for Supply Management showed.
The sector index compiled by the ISM, which indicates general direction, rose 1.9 percentage points to a five-month high of 48.4 in November after unexpectedly slipping to 46.5 in October from 47.2 recorded in both September and August. The latest reading came in well above the median economist forecast of 47.6.
"Demand remains weak, as companies prepare plans for 2025 with the benefit of the election cycle ending," Timothy Fiore, chair of the ISM Manufacturing Business Survey Committee, said in a statement, repeating similar comments he had made previously. "Production execution eased in November, consistent with demand sluggishness and weak backlogs. Suppliers continue to have capacity, with lead times improving but some product shortages reappearing."
"New order rates expanded only marginally as backlog levels continued to decline, causing manufacturers to reduce output to close the calendar year," Fiore said. But he also pointed to a silver lining in the November report that "companies are showing signs of willingness to invest in inventory, a marked departure from the last two years of activity."
Concerns over a possible inflationary fiscal policy stance under the Trump administration is "not going away" but firms are looking at the positive side as Republicans tend to be "business friendly," Fiore told reporters.
Asked about Canadian Prime Minister Justin Trudeau's surprise visit with Trump and his incoming team over the weekend, Fiore said, "We've seen this (diplomatic) style before. Hopefully it works (to defuse trade friction)." Trump said last week that he would impose a 25% tariff on all goods from Mexico and Canada as soon as he takes office on Jan. 20, and that he would also slap an additional 10% tariff on imports from China, all part of his drive to crack down on illegal drugs and immigration.
Fiore said he still believes the ISM manufacturing PMI will pop above the crucial 50 mark in the January-March quarter of 2025 in a long overdue recovery from the post-pandemic slowdown that was caused by heightened geopolitical risks and uncertainties over the U.S. fiscal and monetary policy trajectories.
Fiore repeated that the U.S. manufacturing sector is away from a serious downturn and the November ISM report supports the path toward soft-landing amid signs of slowing but resilient employment and consumption.
The ISM index has averaged 47.4 in the latest 25-month period (from October 2022, when the index slipped to the neutral line of 50 from 50.8 the previous month), compared to 44.2 during the 18-month Great Recession that spanned from February 2028 (48.8) until July 2009 (49.7). This is the longest sectorial recession since the 25-month downturn that lasted from May 1989 (49.3) until May 1991 (44.5), ISM data shows.
Among the five subindexes that directly factor into the manufacturing PMI, the new orders index expanded in November after seven consecutive months in contraction, registering 50.4, an increase of 3.3 points compared to October's figure of 47.1. However, it still hasn't indicated consistent growth since a 24-month streak of expansion ended in May 2022.
The production index continued in contraction territory in November, hovering at 46.8, which was just 0.6 point above 46.2 in October. The index rose to 49.8 in September from 44.8 in August, which was the lowest since 34.2 in May 2020, when world demand plunged at the initial phase of the pandemic.
The employment index stood at a five-month high of 48.1 in November, up 3.7 points from 44.4 in October. Of the six big manufacturing sectors, only one (food, beverage & tobacco products) expanded employment. "Respondents' companies are continuing to reduce head counts through layoffs, attrition and hiring freezes," Fiore said. "This sentiment was supported in November by the approximately 1-to-1.5 ratio of hiring versus staff reduction comments, compared to a 1-to-3 ratio the previous month, meaning less workforce reduction activity."
The delivery performance of suppliers to manufacturing organizations was faster in November, with the supplier deliveries index registering 48.7, a 3.3-point decrease compared to the reading of 52.0 reported in October. This expansion follows four consecutive months of slower deliveries, preceded by four straight months of faster deliveries.
The manufacturing inventories index stood at 48.1 percent in November, up a notable 5.5 points compared to the reading of 42.6 in October. It has remained under the neutral line of 50 for the past 22 months except in August 2024.
Among other subindexes, the prices paid index was at 50.3, down 4.5 points from 54.8 in October, indicating raw materials prices increased for the second straight month in November after decreasing in September. Aluminum, copper, and natural gas posted slight gains, offset by steel, plastic resins and crude oil moving down. In November 12% of companies reported higher prices, down from 20% in October.
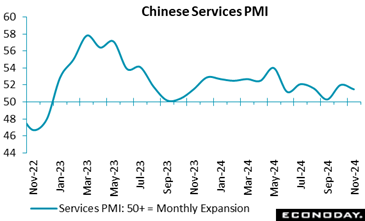 The S&P Global PMI composite index for China rose to a five-month high of 52.3 in November from 51.9 in October, indicating that the Chinese economy has gained some momentum after officials delivered policy measures aimed at boosting growth in the last two months. The business activity index for China's services sector, however, fell to 51.5 from 52.0, whereas the headline index for the manufacturing PMI survey, published earlier in the week, indicated somewhat stronger expansion in the sector. Official PMI survey data, meanwhile, showed steady and subdued conditions in both the manufacturing and the non-manufacturing sector in November. The S&P Global PMI composite index for China rose to a five-month high of 52.3 in November from 51.9 in October, indicating that the Chinese economy has gained some momentum after officials delivered policy measures aimed at boosting growth in the last two months. The business activity index for China's services sector, however, fell to 51.5 from 52.0, whereas the headline index for the manufacturing PMI survey, published earlier in the week, indicated somewhat stronger expansion in the sector. Official PMI survey data, meanwhile, showed steady and subdued conditions in both the manufacturing and the non-manufacturing sector in November.
Respondents to today's service sector survey reported weaker growth in output, new orders, and new export orders in November. The survey showed a third consecutive increase in payrolls while its measure of confidence rose to its highest level since April. Respondents also reported slower growth in input costs third decline in selling prices in the last four months.
Today's data were weaker than the consensus forecast of 52.4 for the service sector survey's headline index.
The global economy is still underperforming.
Econoday’s Relative Economic Performance Index (RPI) slipped further below zero last week. At minus 16, the latest reading shows recent global activity struggling to keep up with market forecasts. The U.S. and Canada are essentially matching expectations but China, the Eurozone, Japan, and the UK are all falling short.
In the U.S., the key November employment update helped to lift both the RPI and the RPI-P to 2. In other words, economic activity in general is performing much as anticipated which should leave forecasters all the more confident about another 25 basis point cut by the Federal Reserve next week.
In Canada, a mixed November employment left the RPI at exactly zero and the RPI at minus 8. Overall, recent data have contained few surprises and will have done nothing to dent expectations for another cut in Bank of Canada interest rates on Wednesday.
Ahead of Thursday’s European Central Bank announcement, the Eurozone RPI and the RPI-P closed out the week at minus 15 and minus 12 respectively. Neither reading indicates forecasters being especially wide of the mark but underperformance has been a feature of the economy since mid-November. A 25 basis point cut still looks the best bet with a not insignificant chance of 50 basis points.
In the UK, downside surprises continue to dominate and put the RPI at minus 11 and the RPI-P at minus 35. Consistently sub-zero readings since late October have kept the door open for another cut in Bank Rate next week but the unexpectedly firm October inflation update still makes a steady stance more likely.
In Switzerland, a firmer than expected November labour market helped to nudge the RPI (minus 5) to within striking distance of zero. Accordingly, with the RPI-P (3) even closer, the message is that recent economic activity in general has all but matched forecasts. However, that still leaves the Swiss National Bank on course to announce at least a 25 basis point cut on Thursday and, quite probably, a larger 50 basis point ease.
In Japan, surprisingly strong household spending was only enough to lift the RPI to minus 14 and the RPI-P to minus 35. Downside shocks still hold the balance but accelerating inflation will keep the Bank of Japan in tightening mode, albeit at probably only a modest pace.
In China, early indications of surprisingly sluggish activity in November dragged the RPI down to minus 36 and the RPI-P to minus 33. The impact of the recent massive wave of stimulus measures is not currently living up to expectations.
**Contributing to this article were Jeremy Hawkins, Brian Jackson, Mace News, Max Sato, Olajide Oyadeyi, and Theresa Sheehan
On Tuesday, Australia RBA is expected to announce no change in the rate, and forecasters see no rate move until February or May of next year.
Germany’s consumer price index is estimated to have no revision from the flash at minus 0.2 percent on the month and up 2.2 percent on year. HICP is seen unrevised at minus 0.7 percent and up 2.4 percent, respectively.
Wednesday, the US consumer price index is expected to show an increase of 0.3 percent on the month and an increase of 2.7 percent on the year for November as opposed to a 0.2 percent and 2.6 percent increase in October. The core is expected at a sticky 0.3 percent and 3.3 percent on the year, the same as in October and September. With readings like this, the expectation for the December Fed policy meeting remains split between a 25 bp cut and no action, although the latest soft-ish jobs report underpins rising expectations for 25.
Canada’s Bank of Canada is expected to announce a routine 25 basis point cut or a more aggressive 50 basis points. After mostly disappointing data, including the latest rise in unemployment, the Econoday consensus looks for 50.
Japan’s producer price index is estimated to rise at a 3.4 percent annual rate in November after accelerating to 3.4 percent in October from 3.1 percent in September amid a spike in farm produce costs caused by rare and acute domestic rice shortages, which appears to have lingered into November. The high pace of increase is also due to reduced subsidies for utilities. The uptick in the corporate goods price index tends to feed into consumer prices about six months later. On the month, the CGPI is forecast to post a 0.2 percent rise after rising at the same rate the previous month. The bank is widely expected to raise the target for the overnight interest rate by 25 basis points to 0.5 percent at its next meeting on Dec. 18-19 after leaving it steady at 0.25 percent in September, raising it to the current level from a range of 0 percent to 0.1 percent in July and conducting its first rate hike in 17 years in March when it also ended its seven-year-old yield curve control framework.
Thursday, the Australian labour force survey for November is expected to show a modest 25,000 increase. The jobless rate is expected to tick up to 4.2 percent from 4.1 percent.
The UK monthly GDP is expected to go up 0.2 percent on the month in October versus minus 0.1 percent in September.
The Eurozone ECB is expected to announce cut its key rates by 25 basis points rather than the more aggressive 50 basis points that doves will advocate as downside risks have multiplied.
The US producer price index final demand for November is estimated to increase 0.3 percent on month and 2.6 percent on year. Excluding food and energy the PPI-FD is expected to go up 0.2 percent on the month and 3.2 percent on the year.
China CPI for November (Mon 0945 CST; Mon 0145 GMT; Sun 2045 EST)
Consensus Forecast, Y/Y: 0.4%
Consensus Range, Y/Y: 0.4% to 0.4%
Forecasters see China CPI up 0.4 percent in the latest month from a year ago versus 0.3 percent a month ago.
China PPI for November (Mon 0930 CST; Mon 0130 GMT; Sun 2030 EST)
Consensus Forecast, Y/Y: -2.8%
Consensus Range, Y/Y: -2.9% to -2.6%
China’s wholesale prices remain mired in deflation. PPI is expected down 2.8 percent from a year ago in the latest month compared with a decline of 2.9 percent a month ago.
US Wholesale Inventories (Preliminary) for October (Fri 1000 EST; Fri 1500 GMT)
Consensus Forecast, M/M: 0.1%
Consensus Range, M/M: 0.0% to 0.2%
The consensus looks for a slight revision to 0.1 percent from 0.2 percent in the flash.
Australia RBA Announcement (Tue 1430 AET; Tue 0330 GMT; Mon 2230 EST)
Consensus Forecast, Change: 0 bp
Consensus Range, Change: 0 bp to 0 bp
Consensus Forecast, Level: 4.35%
Consensus Range, Level: 4.35% to 4.35%
Weak data lately put pressure on the Australian dollar as some traders bet the RBA would kick off its long-awaited rate cut cycle soon. Still, RBA officials have remained hawkish and forecasters generally see no rate move until February or May of next year.
China Trade Balance
Consensus Forecast $ Blns: $91.0 B
Consensus Forecast Range $ Bln: $89.0 B to $94.3 B
The consensus looks for the trade surplus to narrow to $91.0 billion in November from $95.3 billion in October.
Germany CPI for November (Tue 0800 CET; Tue 0700 GMT; Tue 0200 EST)
Consensus Forecast, M/M: -0.2%
Consensus Range, M/M: -0.2% to -0.2%
Consensus Forecast, Y/Y: 2.2%
Consensus Range, Y/Y: 2.2% to 2.2%
HICP Consensus Forecast, M/M: -0.7%
HICP Consensus Range, M/M: -0.7% to -0.7%
HICP Consensus Forecast, Y/Y: 2.4%
HICP Consensus Range, Y/Y: 2.4% to 2.4%
Forecasters look for no revision from the flash at minus 0.2 percent on the month and up 2.2 percent on year. HICP is seen unrevised at minus 0.7 percent and up 2.4 percent, respectively.
US NFIB Small Business Optimism Index for November (Tue 0600 EST; Tue 1100 GMT)
Consensus Forecast, Index: 94.5
Consensus Range, Index: 94.0 to 96.0
Business confidence has perked up on the view that a Trump presidency is good news for business and as the Federal Reserve appears to be engineering a soft landing. The consensus looks for NFIB business sentiment at 94.5 in November versus 93.7 in October.
US Productivity and Costs for Third Quarter (Tue 0830 EST; Tue 1330 GMT)
Consensus Forecast, Nonfarm Productivity - Annual Rate: 2.2%
Consensus Range, Nonfarm Productivity - Annual Rate: 2.2% to 2.9%
Consensus Forecast, Unit Labor Costs - Annual Rate: 1.9%
Consensus Range, Unit Labor Costs - Annual Rate: 0.7% to 2.0%
Revised data for Q3 expected to show no revision from the prior report with productivity holding at a growth rate of an annual 2.2 percent and unit labor costs at an annual 1.9 percent.
US CPI for October (Wed 0830 EST; Wed 1330 GMT)
Consensus Forecast, CPI - M/M: 0.3%
Consensus Range, CPI - M/M: 0.2% to 0.3%
Consensus Forecast, CPI - Y/Y: 2.7%
Consensus Range, CPI - Y/Y: 2.6% to 2.7%
Consensus Forecast, Ex-Food & Energy - M/M: 0.3%
Consensus Range, Ex-Food & Energy - M/M: 0.2% to 0.3%
Consensus Forecast, Ex-Food & Energy - Y/Y: 3.3%
Consensus Range, Ex-Food & Energy - Y/Y: 3.2% to 3.3%
How we wish the inflation numbers were improving! Forecasters expect headline CPI to show increases of 0.3 percent on the month and 2.7 percent on the year for November versus 0.2 percent and 2.6 percent in October. The core is expected at a sticky 0.3 percent and 3.3 percent on the year, the same as in October and September. With readings like this, the expectation for the December Fed policy meeting remains split between a 25 bp cut and no action, although the latest soft-ish jobs report underpins rising expectations for 25.
Canada Bank of Canada Announcement (Tue 0945 EST; Tue 1445 GMT)
Consensus Forecast, Change: -50 bp
Consensus Range, Change: -50bp to -25bp
Consensus Forecast, Level: 3.25%
Consensus Range, Level: 3.25% to 3.50%
Markets have been split on whether the governing council will deliver a routine 25 basis point cut or a more aggressive 50 basis points. After mostly disappointing data, including the latest rise in unemployment, the Econoday consensus looks for 50.
Australia Labour Force Survey for November (Thu 1130 AET; Thu 0030 GMT; Wed 1930 EST)
Consensus Forecast, Employment - M/M: 25,000
Consensus Range, Employment - M/M: 15,000 to 50,000
Consensus Forecast, Unemployment Rate: 4.2%
Consensus Range, Unemployment Rate: 4.1% to 4.2%
Job growth in Australia has faltered lately with employment up 16,000 in October, below expectations for 25,000. That followed average monthly gains of 50,000 in the third quarter. November is expected to show a modest 25,000 increase. The jobless rate is expected to tick up to 4.2 percent from 4.1 percent.
UK Monthly GDP for October (Thu 0700 GMT; Thu 0200 EST)
Consensus Forecast, M/M: 0.2%
Consensus Range, M/M: 0.1% to 0.2%
Growth is expected to go up 0.2 percent on the month in October versus minus 0.1 percent in September.
UK Industrial Production for October (Thu 0700 GMT; Thu 0200 EST)
Consensus Forecast, Industrial Production - M/M: 0.3%
Consensus Range, Industrial Production - M/M: 0.3% to 0.3%
Consensus Forecast, Industrial Production - Y/Y: 0.2%
Consensus Range, Industrial Production - Y/Y: 0.2% to 0.2%
Forecasters see industrial production rebounding by 0.3 percent on the month in November after falling 0.5 percent in October. Output is seen up 0.2 percent on the year after dropping 1.8 percent in October.
Switzerland SNB Monetary Policy Assessment for December (Thu 0930 CET; Thu 0830 GMT; Thu 0330 EST)
Consensus Forecast, Change: -25 bp
Consensus Range, Change: -25 bp to -25 bp
Consensus Forecast, Level: 0.75%
Consensus Range, Level: 0.75% to 0.75%
The call is a fourth consecutive 25 basis point rate cut as the SNB combats deflation, the rising Swiss franc, and spillover from Germany’s weak economy.
Eurozone ECB Announcement (Thu 1415 CET; Thu 1315 GMT; Thu 0815 EST)
Consensus Forecast, Refi Rate Change: -25 bp
Consensus Range, Refi Rate Change: -25 bp to -25 bp
Consensus Forecast, Refi Rate Level: 3.15%
Consensus Range, Refi Rate Level: 3.15% to 3.15%
Consensus Forecast, Deposit Rate Change: -25 bp
Consensus Range, Deposit Rate Change: -25 bp to -25 bp
Consensus Forecast, Deposit Rate Level: 3.0%
Consensus Range, Deposit Rate Level: 3.0% to 3.0%
The ECB is expected to take the cautious path and cut its key rates by 25 basis points rather than the more aggressive 50 basis points that doves will advocate as downside risks have multiplied.
US Jobless Claims (Thu 0830 EST; Thu 1330 GMT)
Consensus Forecast, Initial Claims - Level: 220K
Consensus Range, Initial Claims - Level: 190K to 225K
Claims popped up unexpectedly by 9,000 to 224,000 last week; forecasters look for 220,000 this week.
US PPI-Final Demand for November (Thu 0830 EST; Thu 1330 GMT)
Consensus Forecast, PPI-FD - M/M: 0.3%
Consensus Range, PPI-FD - M/M: 0.1% to 0.3%
Consensus Forecast, PPI - Y/Y: 2.6%
Consensus Range, PPI - Y/Y: 2.4% to 2.7%
Consensus Forecast, Ex-Food & Energy - M/M: 0.2%
Consensus Range, Ex-Food & Energy - M/M: 0.1% to 0.3%
Consensus Forecast, Ex-Food & Energy - Y/Y: 3.2%
Consensus Range, Ex-Food & Energy - Y/Y: 3.2% to 3.2%
Headline PPI-FD is expected to show increases of 0.3 percent on month and 2.6 percent on year. Ex-food and energy PPI-FD is expected up 0.2 percent and 3.2 percent, respectively.
Eurozone Industrial Production for October (Fri 1100 CET; Fri 1000 GMT; Fri 0500 EST)
Consensus Forecast, M/M: 0.0%
Consensus Range, M/M: -0.5% to 0.5%
Eurozone industrial output is expected flat on the month in October after a nasty 2.0 percent drop on the month in September.
Canada Manufacturing Sales for October (Fri 0830 EST; Fri 1330 GMT)
Consensus Forecast, M/M: 1.3%
Consensus Range, M/M: 1.3% to 1.3%
Forecasters agree with Statistics Canada’s preliminary estimate of plus 1.3 percent for October after two straight declines in September and August. StatsCan released the October estimate on Nov. 25.
US Imports and Export Prices for November (Tue 0830 EST; Tue 1330 GMT)
Consensus Forecast, Import Prices - M/M: -0.3%
Consensus Range, Import Prices - M/M: -0.3% to 0.3%
Consensus Forecast, Import Prices - Y/Y: 1.0%
Consensus Range, Import Prices - Y/Y: 1.0% to 1.0%
Consensus Forecast, Export Prices - M/M: -0.1%
Consensus Range, Export Prices - M/M: -0.5% to 0.9%
The consensus looks for import prices down 0.3 percent on the month and up 1.0 percent on the year. For exports, the call is minus 0.1 percent on the month.
|

