|
Europe Preview
PMI Surveys May Be First to Detect Tariff Impacts
By Jeff Czernek, Econoday Economist
While tariffs on imported goods tend to raise inflationary pressures for the country imposing them, they conversely tend to slow down growth and give rise to deflationary pressures in the countries supplying those goods. What is happening in the case of the 25 percent tariff imposed by the United States on all steel and aluminum product imports? How will tariffs on these goods affect the European economies exporting them? The initial impact and reaction may first appear in the results of surveys like the ones scheduled for release in the week ahead.
On Monday, the flash PMIs for Germany, UK, France and the Eurozone present a near-real-time snapshot of business sentiment and underlying demand, with insights into shifts in ordering, production and overall sectoral health as it responds to tariffs or new cost pressures. The cross-country nature of these releases will enable comparisons of regional responses. Last month, France was the weakest of the group, posting a contractionary, sub-50 reading for all three indices measured: 45.1 for the Composite, 45.8 for Manufacturing, and 45.3 for Services. Although France was the only one in the group registering contraction in services, manufacturing was in contraction for them all, and has been for some time. In February, the level of manufacturing contraction stood at 46.5 for Germany, 47.6 for the Eurozone, and 46.9 for the UK. A sign of how bad things are for European manufacturing is that these low scores are actually high relative to previous months – and for Germany, a 25-month high!
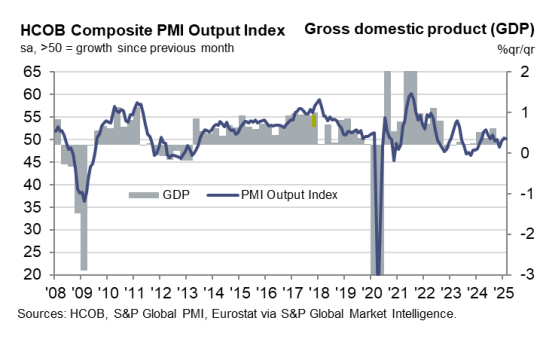
Meanwhile the composite score of the other three remained above the 50 contraction/expansion threshold in February, but barely so, suggesting vulnerability, with Germany at 50.4, the Eurozone at 50.2, and the UK at 50.5. Note that expansion is the Composite PMI is highly correlated with GDP growth, and its monthly contractions are often accompanied by recessions, as shown below for the Eurozone.
Yet it is in the Manufacturing PMI surveys that the biggest direct negative effects from the tariffs imposed by the US are likely to be noted. The annual costs to Germany, the largest steel exporter in the EU, are estimated at $2.5 billion, while the annual costs to Italy, France and the UK are estimated at roughly $1.8 billion, $1.2 billion and $900 million, respectively. Not a pittance, but also not unmanageable within the scales of these industries. Costs would of course be much greater if the potential ripple effects on industries reliant on these materials were included. Moreover, in the worst-case scenario, the steel and aluminum tariffs may only be the opening salvo, with many more to come, perhaps amounting to hundreds of billions of dollars, in order to try to fulfill President Trump’s sometimes-floated idea to use them to replace US federal income tax receipts, or about $2.3 trillion annually. Please note that although tariffs on steel and aluminum were announced on February 10th, they did not go into effect until March 12th, so that their impact may still not be fully reflected in the flash surveys for March.
As luck would have it, Germany, deserving special attention in this context, offers a bonus survey on Tuesday, the Ifo Business Climate Index. Published by the Ifo Institute for Economic Research, the Business Climate index is an early indicator of morale in German Industry, surveying over 9,000 enterprises in manufacturing, services, construction, wholesaling and retailing. Ifo last readings, published in February, indicated cautiousness, reflected in the Business Climate, which held steady at 85.2, as a downward pull in Current Conditions to 85.0 from 86.0 was offset by an upward push in Business Expectations from 84.2 to 85.4.
The 5-year chart below shows that this seriously cautious attitude has not been short-lived. One can also observe the functioning of the business expectations line as a leading indicator, guiding the line of current conditions (assessment of business situation) gradually downward into the mid-80s where the expectations and current conditions converge.
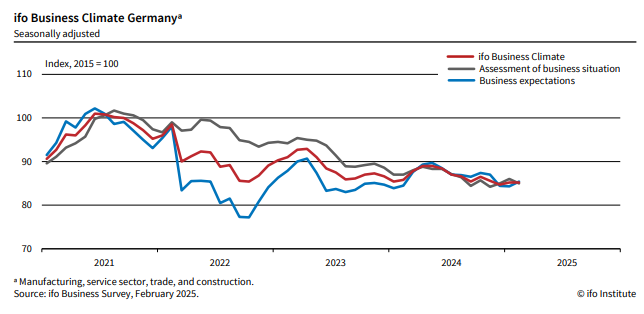
Notice that the plunge by the business expectations line roughly corresponds to the time of the start of the war in Ukraine and the start of the high costs of energy that have hampered many German businesses. Given the lack of vigor indicated by the convergence on a horizontal path at a level 15 percent below the 2015 base, it is no wonder that the Ifo Institute forecasts a 0.2 percent growth rate for German GDP in 2025.
Housing, Regional Manufacturing Surveys in Focus
By Teresa Sheehan, Econoday Economist
Data reports in the March 24 week see few standouts. Most of it will complement reports already released to fill out the picture of economic activity, particularly for the housing sector through February. There are regional surveys of manufacturing on the calendar which will provide a look at more current activity.
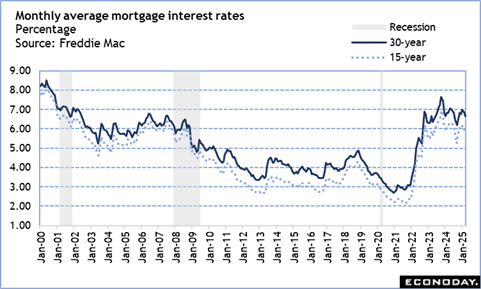
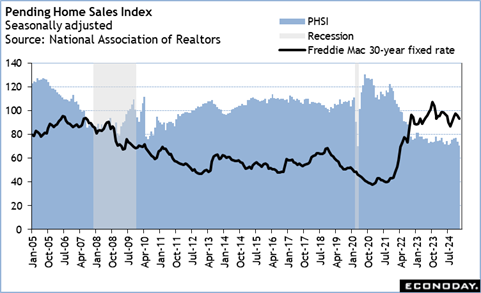
The data on the housing market needs to take into account that there was bitterly cold weather in January that probably kept some activity in check with a rebound to be expected in February. There is also that mortgage rates hit short-term peak in January. The monthly average for a Freddie Mac 30-year fixed rate mortgage was around 7 percent in January, steadily declined to around 6.8 percent in February, and is around 6.7 percent in the first three weeks of March.
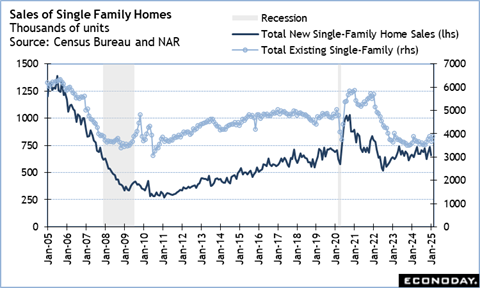
The February numbers of sales of new single-family homes at 10:00 ET on Tuesday will probably confirm some shifts in the housing market. The data on sales of existing homes in February – which are for contracts closed – showed a 5.7 percent increase in sales of single-family units to 3.890 million and is essentially unchanged from 3.900 million units in February 2024. It is reasonable to expect that sales of new single-family homes – which are for contracts signed – will recover from the 10.5 percent month-over-month decline to 657,000 in January from December. However, now that inventories of existing homes are more plentiful and price increases less aggressive, new construction may be less attractive to potential buyers.
The NAR pending home sales index for February at 10:00 ET on Thursday will show if the upward momentum for home resales was just a rebound from January or if more homebuyers are active this spring and/or if the dip in mortgage rates has tempted some households to buy despite worries about the economy and job security.
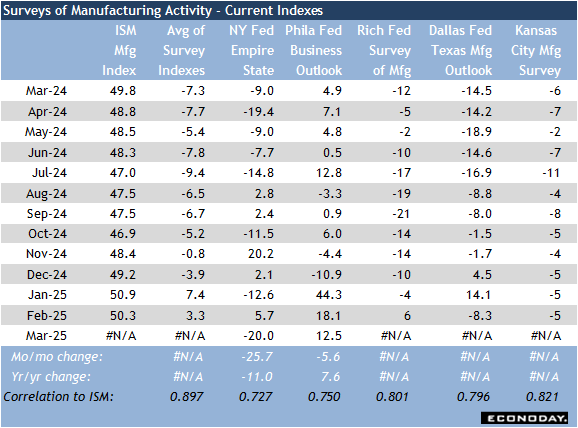
There are two more regional surveys of manufacturing on the calendar with the Richmond Fed’s manufacturing composite index at 10:00 ET on Tuesday and the Kansas City Fed’s manufacturing index at 11:00 ET on Thursday. The indexes from the New York and Philadelphia Feds already pointed to slower activity in March. The general business conditions index in the Philadelphia survey is down 5.6 points to 12.5 and reflects modest expansion. The New York Fed’s general business conditions index plunged 25.7 points to minus 20.0 in March. The New York measure tends to swing dramatically month-to-month. A two-month moving average suggests that underlying activity is in contraction, but only slightly.
In any case, the manufacturing sector is feeling the effects of heightened uncertainty. The future conditions index for New York and Philadelphia both indicate falling hopes for ongoing expansion.
Personal income and spending reports due on Friday are not expected to move the needle, and the PCE price index numbers are expected to show another month of 0.3 percent increases, pointing to no change in the inflation picture.
Inflation Data in Focus
By Brian Jackson, Econoday Economist
Monthly inflation data from Australia will be the highlight of the Asia-Pacific data calendar. Headline monthly inflation has been steady in the last few months and for the last six months has been within the Reserve Bank of Australia's target range of two percent to three percent. This was enough to prompt officials to cut policy rates last month for the first time since 2020. Lower headline inflation, however, partly reflects energy rebates and the RBA also indicated last month that they are reluctant to ease policy further unless they see evidence of further moderation in underlying price pressures.
Elsewhere in the region, Singapore will be reporting inflation and industrial production data for February. The Monetary Authority of Singapore also eased policy setting at its most recent policy meeting late January, targeting a more modest and gradual pace of currency appreciation. Officials revised down their inflation forecasts for this year and also expressed greater uncertainty about the global outlook. Next week's data will provide key information ahead of their next policy meeting mid-April. Hong Kong trade and Taiwan industrial production data will also be watched for indications that global trade tensions are having an impact on regional activity.
Singapore CPI for February (Mon 1300 SGT; Mon 0500 GMT; Mon 0100 EDT)
Consensus Forecast, Y/Y: 1.1%
Consensus Range, Y/Y: 0.9% to 1.2%
CPI is expected to rise 1.1 percent from a year ago in February versus 1.2 percent in January.
Germany PMI Composite Flash for March (Mon 0930 CET; Mon 0830 GMT; Mon 0430 EDT)
Consensus Forecast, Composite Index: 51.2
Consensus Range, Composite Index: 51.1 to 51.5
Consensus Forecast, Manufacturing Index: 47.0
Consensus Range, Manufacturing Index: 47.0 to 48.0
Consensus Forecast, Services Index: 51.5
Consensus Range, Services Index: 51.0 to 52.0
A modest improvement is seen across the board with manufacturing flash still in contraction at 47.0, services outperforming at 51.5 and composite at 51.2.
Eurozone PMI Composite Flash for April (Mon 1000 CET; Mon 0900 GMT; Mon 0500 EDT)
Consensus Forecast, Composite Index: 50.5
Consensus Range, Composite Index: 50.5 to 50.9
Consensus Forecast, Manufacturing Index: 48.0
Consensus Range, Manufacturing Index: 48.0 to 48.3
Consensus Forecast, Services Index: 51.0
Consensus Range, Services Index: 50.5 to 51.1
The manufacturing flash is expected at 48.0, services at 51.0 and composite at 50.5.
United Kingdom PMI Composite Flash for March (Mon 0930 GMT; Mon 0530 EST)
Consensus Forecast, Manufacturing Index: 47.0
Consensus Range, Manufacturing Index: 47.0 to 47.0
Consensus Forecast, Services Index: 51.3
Consensus Range, Services Index: 51.0 to 51.4
The manufacturing flash is expected nearly flat at a gloomy 47.0 with services unchanged but outperforming at 51.0.
United States PMI Composite Flash for March (Mon 0945 EDT; Mon 1345 GMT)
Consensus Forecast, Manufacturing Index: 51.8
Consensus Range, Manufacturing Index: 51.5 to 52.2
Consensus Forecast, Services Index: 51.2
Consensus Range, Services Index: 50.1 to 53.0
Manufacturing index seen lower but still expansionary at 51.8 and services slightly better at 51.2.
Germany Ifo Survey for March (Tue 1000 CET; Tue 0900 GMT; Tue 0500 EDT)
Consensus Forecast, Business Climate: 87.0
Consensus Range, Business Climate: 86.0 to 87.9
Consensus Forecast, Current Conditions: 85.2
Consensus Range, Current Conditions: 84.9 to 85.5
Consensus Forecast, Business Expectations: 86.8
Consensus Range, Business Expectations: 86.4 to 90.5
Things are looking up in Germany with movement toward more government spending on infrastructure and defense. Business climate is expected up at 87.0 versus 85.2 in the prior month. Current conditions is seen at 85.2 versus 85.0 and expectations at 86.8 versus 85.4.
United States Case-Shiller Home Price Index for January (Tue 0900 EDT; Tue 1300 GMT)
Consensus Forecast, 20-City Unadjusted - Y/Y: 4.5%
Consensus Range, 20-City Unadjusted - Y/Y: 4.4% to 4.6%
The 20-city composite index is expected up 4.5 percent again in January after rising 4.5 percent in December, and 4.3 percent in November.
United States Consumer Confidence for March (Tue 1000 EST; Tue 1400 GMT)
Consensus Forecast, Index: 94.2
Consensus Range, Index: 91.5 to 98.3
Consumers are in a funk. Another decline to 94.2 is the call for March, down from 98.3 in February,105.3 in January and 109.5 in December. Consumers are fretting over the economic outlook, their family finances and they see rising inflation.
United States New Home Sales for February (Tue 1000 EDT; Tue 1400 GMT)
Consensus Forecast, Annual Rate: 679 K
Consensus Range, Annual Rate: 650 K to700 K
Sales expected to bounce to 679K unit rate in February after dropping surprisingly to 657K in January after rising to 734K in December.
United States Richmond Fed Manufacturing Index for March (Tue 1000 EDT; Tue 1400 GMT)
Consensus Forecast, Index: 5.0
Consensus Range, Index: 0.0 to 8.0
Forecasters see the index roughly flat at 5.0 in March versus 6.0 in February.
Australia Monthly CPI for February (Wed 1130 CET; Wed 1030 GMT; Wed 0630 EDT)
Consensus Forecast, Y/Y: 2.4%
Consensus Range, Y/Y: 2.3% to 2.7%
Forecasters expect annual CPI at 2.4 percent in February versus 2.5 percent in January.
United Kingdom CPI for February (Wed 0700 CET; Wed 0600 GMT; Wed 0200 EDT)
Consensus Forecast, M/M: 0.5%
Consensus Range, M/M: 0.3% to 0.5%
Consensus Forecast, Y/Y: 2.9%
Consensus Range, Y/Y: 2.8% to 3.0%
UK annual inflation seen at 2.9 percent in February versus 3.0 percent in January. Month on month, the consensus looks for a 0.5 percent bounce after minus 0.1 percent in January.
United States Durable Goods Orders for February (Wed 0830 EDT; Wed 1230 GMT)
Consensus Forecast, New Orders - M/M: -1.0%
Consensus Range, New Orders - M/M: -1.5% to 1.3%
Consensus Forecast, Ex-Transportation - M/M: 0.3%
Consensus Range, Ex-Transportation - M/M: -0.3% to 0.5%
After a big jump in January, orders are expected to fall back by 1.0 percent in February, led by weaker bookings at Boeing.
Eurozone M3 Money supply for February (Thu 1000 CET; Thu 0900 GMT; Thu 0500 EDT)
Consensus Forecast, Y/Y - 3-Month Moving Average: 3.8%
Consensus Range, Y/Y- 3-Month Moving Average: 3.6% to 3.8%
Money supply growth is seen at 3.8 percent in February versus 3.6 percent in January.
United States GDP for Fourth Quarter (Thu 0830 EDT; Thu 1230 GMT)
Consensus Forecast, Q/Q - Annual Rate: 2.4%
Consensus Range, Q/Q - Annual Rate: 2.2% to 2.5%
Consensus Forecast, Personal Consumption Expenditures - Annual Rate: 4.2%
Consensus Range, Personal Consumption Expenditures - Annual Rate: 4.2% to 4.2%
A slight upward revision to 2.4 percent from 2.3 percent is the call for GDP.
United States International Trade in Goods (Advance) for February (Thu 0830 EDT; Thu 1230 GMT)
Consensus Forecast, Balance: -$135.5 B
Consensus Range, Balance: -$145.0 B to -$131.1 B
After rising $33.5 billion to a whopping $156.8 billion in January, the consensus sees the deficit lower at $135.5 billion in February, still very high, reflecting import orders front-running tariffs.
United States Jobless Claims (Thu 0830 EDT; Thu 1230 GMT)
Consensus Forecast, Initial Claims - Level: 225 K
Consensus Range, Initial Claims - Level: 217 K to 230 K
Claims are seen at 225K after rising 2K to 223K in the previous week, consistent with a surprisingly stable jobs market.
United States Pending Home Sales Index for February (Thu 1000 EDT; Thu 1400 GMT)
Consensus Forecast, M/M: 2.9%
Consensus Range, M/M: 1.6% to 4.8%
Sales are seen recovering by 2.9 percent in February after dropping 4.5 percent in January.
Japan Tokyo CPI for March (Fri 0830 JST; Thu 2330 GMT; Thu 130 EDT)
Consensus Forecast, CPI - Y/Y: 2.8%
Consensus Range, CPI - Y/Y: 2.7% to 3.0%
Consensus Forecast, Ex-Fresh Food - Y/Y: 2.2%
Consensus Range, Ex-Fresh Food - Y/Y: 2.2% to 2.3%
Consensus Forecast, Ex-Fresh Food & Energy - Y/Y: 2.0%
Consensus Range, Ex-Fresh Food & Energy - Y/Y: 1.9% to 2.0%
Consumer inflation in Tokyo, the leading indicator of the national average, is expected to be little changed in March from the pace in February, when two of the three key measures eased substantially. CPI inflation is receiving a temporary break from utility subsidies aimed at capping energy costs during the peak heating season from January to March (bills paid from February to April). By contrast, processed food prices remain elevated in the aftermath of protracted domestic rice supply shortages and high import costs caused by the weak yen.
The core reading (excluding fresh food) is forecast to post a 2.2% increase on year after decelerating to 2.2% in February from 2.5% in January. The year-on-year rise in the total CPI is expected to ease slightly to 2.8% after slowing to 2.9% in February and surging to a 22-month high of 3.4% at the start of the year. The annual rate for the core-core CPI (excluding fresh food and energy) is estimated at 2.0%, up from 1.9% the previous month.
United Kingdom Retail Sales for February (Fri 0700 GMT; Fri 0300 EDT)
Consensus Forecast, M/M: 0.0%
Consensus Range, M/M: -0.2% to 0.1%
Sales expected flat in February from January after a 1.7 percent jump in January.
Germany GfK Consumer Climate for Apr (Fri 0800 CET; Fri 0700 GMT; Fri 0300 EDT)
Consensus Forecast, Index: -22.0
Consensus Range, Index: -24.1 to -22.0
Another improvement is expected in a German sentiment indicator, up to minus 22.0 in April from minus 24.7 in March.
United Kingdom GDP for Fourth Quarter (Fri 0700 GMT; Fri 0300 EDT)
Consensus Forecast, Q/Q: 0.1%
Consensus Range, Q/Q: 0.1% to 0.1%
Consensus Forecast, Y/Y: 1.4%
Consensus Range, Y/Y: 1.4% to 1.4%
No revision expected in the final UK GDP reading for Q4 from the previous report.
Germany Unemployment Rate for March (Fri 0955 CET; Fri 0855 GMT; Fri 0455 EDT)
Consensus Forecast, Rate: 6.2%
Consensus Range, Rate: 6.2% to 6.2%
Jobless rate continues at 6.2 percent, unchanged from January and February.
Eurozone EC Economic Sentiment for March (Fri 1100 CET; Fri 1000 GMT; Fri 0600 EDT)
Consensus Forecast, Economic Sentiment: 96.9
Consensus Range, Economic Sentiment: 96.5 to 97.3
Consensus Forecast, Industry Sentiment: 10.7
Consensus Range, Industry Sentiment: -11.0 to -10.5
Economic sentiment expected up slightly to 96.9 in March from 96.3 in February.
Canada Monthly GDP for January (Fri 0830 EDT; Fri 1230 GMT)
Consensus Forecast, M/M: 0.3%
Consensus Range, M/M: 0.1% to 0.4%
Forecasters agree with the Stats Canada estimate seeing GDP up 0.3 percent on the month in January. Growth was picking up at the start of the year before tariffs descended.
United States Personal Income and Outlays for February (Fri 0830 EDT; Fri 1230 GMT)
Consensus Forecast, Personal Income - M/M: 0.4%
Consensus Range, Personal Income - M/M: 0.1% to 0.6%
Consensus Forecast, Personal Consumption Expenditures - M/M: 0.5%
Consensus Range, Personal Consumption Expenditures - M/M: 0.2% to 0.8%
Consensus Forecast, PCE Price Index - M/M: 0.3%
Consensus Range, PCE Price Index - M/M: 0.2% to 0.4%
Consensus Forecast, PCE Price Index - Y/Y: 2.5%
Consensus Range, PCE Price Index - Y/Y: 2.4% to 2.7%
Consensus Forecast, Core PCE Price Index - M/M: 0.3%
Consensus Range, Core PCE Price Index - M/M: 0.2% to 0.3%
Consensus Forecast, Core PCE Price Index - Y/Y: 2.7%
Consensus Range, Core PCE Price Index - Y/Y: 2.6% to 2.8%
Income is seen up 0.4 percent in February after rising a strong 0.9 percent in January. Spending is expected up by a chunky 0.5 percent on the month after falling 0.2 percent in January. The PCE price index is expected up 0.3 percent on the month and 2.5 percent on year. For core PCE prices the call is up 0.3 percent and up 2.7 percent on year.
United States Consumer Sentiment for March (Fri 1000 EDT; Fri 1400 GMT)
Consensus Forecast, Index: 57.9
Consensus Range, Index: 57.5 to 58.0
Consensus Forecast, Year-ahead Inflation Expectations: 4.9%
Consensus Range, Year-ahead Inflation Expectations: 4.9% to 4.9%
No change from the flash is expected with the index unrevised at its recessionary 57.9 in the final March report. No revision is seen in the newly-elevated 1-year inflation expectations figure at 4.9 percent.
|
